



A busy intersection does not automatically need a traffic signal. The useful first question is more specific: which movements are struggling, during which hours, and would signal control improve the overall result? A volume warrant helps organize that investigation. It cannot answer the entire design question.
The MUTCD separates sustained four-hour demand from unusual peak-hour conditions. The distinction matters when a school dismissal, factory shift or commuter surge dominates the conversation. This guide explains Figures 4C-1 through 4C-4 using the current Chapter 4C, with the data checks that make a warrant calculation reproducible.
Start with an intersection count, not a daily traffic number
Annual average daily traffic is useful background, but these figures use vehicles per hour. Their horizontal axis is the major-street volume from both approaches combined. Their vertical axis is the corresponding volume on the more critical minor-street approach, in one direction. Adding both minor approaches changes the question the chart is answering.
Collect turning movements and retain the original 15-minute intervals. Mark the approach lanes, turn restrictions, medians and traffic control on a simple site diagram. Note weather, roadworks, school schedules and unusual events. A count conducted during a detour may be accurate for that day yet poor evidence of an average day.
The engineering study also needs the physical and operating context. Section 4C.01 discusses approach volumes, pedestrian activity, speeds, crashes and intersection conditions. Long queues are worth documenting, but a queue photograph does not establish its cause. A blocked downstream intersection, short turn pocket or poor sight distance can produce a different remedy from insufficient gaps in major-street traffic.
Keep the major and minor counts on the same clock
Consider a hypothetical count: from 7:00 to 8:00, the major approaches carry 520 and 480 vehicles, while the selected minor approach carries 140. The plotted point is therefore 1,000 major-street vehicles per hour and 140 minor-street vehicles per hour. This example explains the axes; it does not establish that a warrant is met.
If the minor approach reaches 210 vehicles from 8:00 to 9:00, that count belongs with the major-street count for 8:00 to 9:00. Pairing the highest major count with the highest minor count from different hours creates a condition that may never have occurred. Similarly, adding four busy 15-minute periods scattered across a day does not create a valid hour.
Section 4C.01 allows an hour to comprise four consecutive 15-minute periods, provided major- and minor-street periods correspond. Keep evaluated hours nonoverlapping. A review sheet should show time, both major approaches, selected minor approach, lane classification and chart used. Another reviewer should be able to reproduce every point without reconstructing the spreadsheet.
Four-hour volume: four separate tests
Under Section 4C.03, Warrant 2 considers each of any four hours of an average day. All four paired points must fall above the applicable curve. The hours need not be consecutive. Averaging their volumes into one apparently strong point loses the hour-by-hour requirement and can conceal a weaker hour.
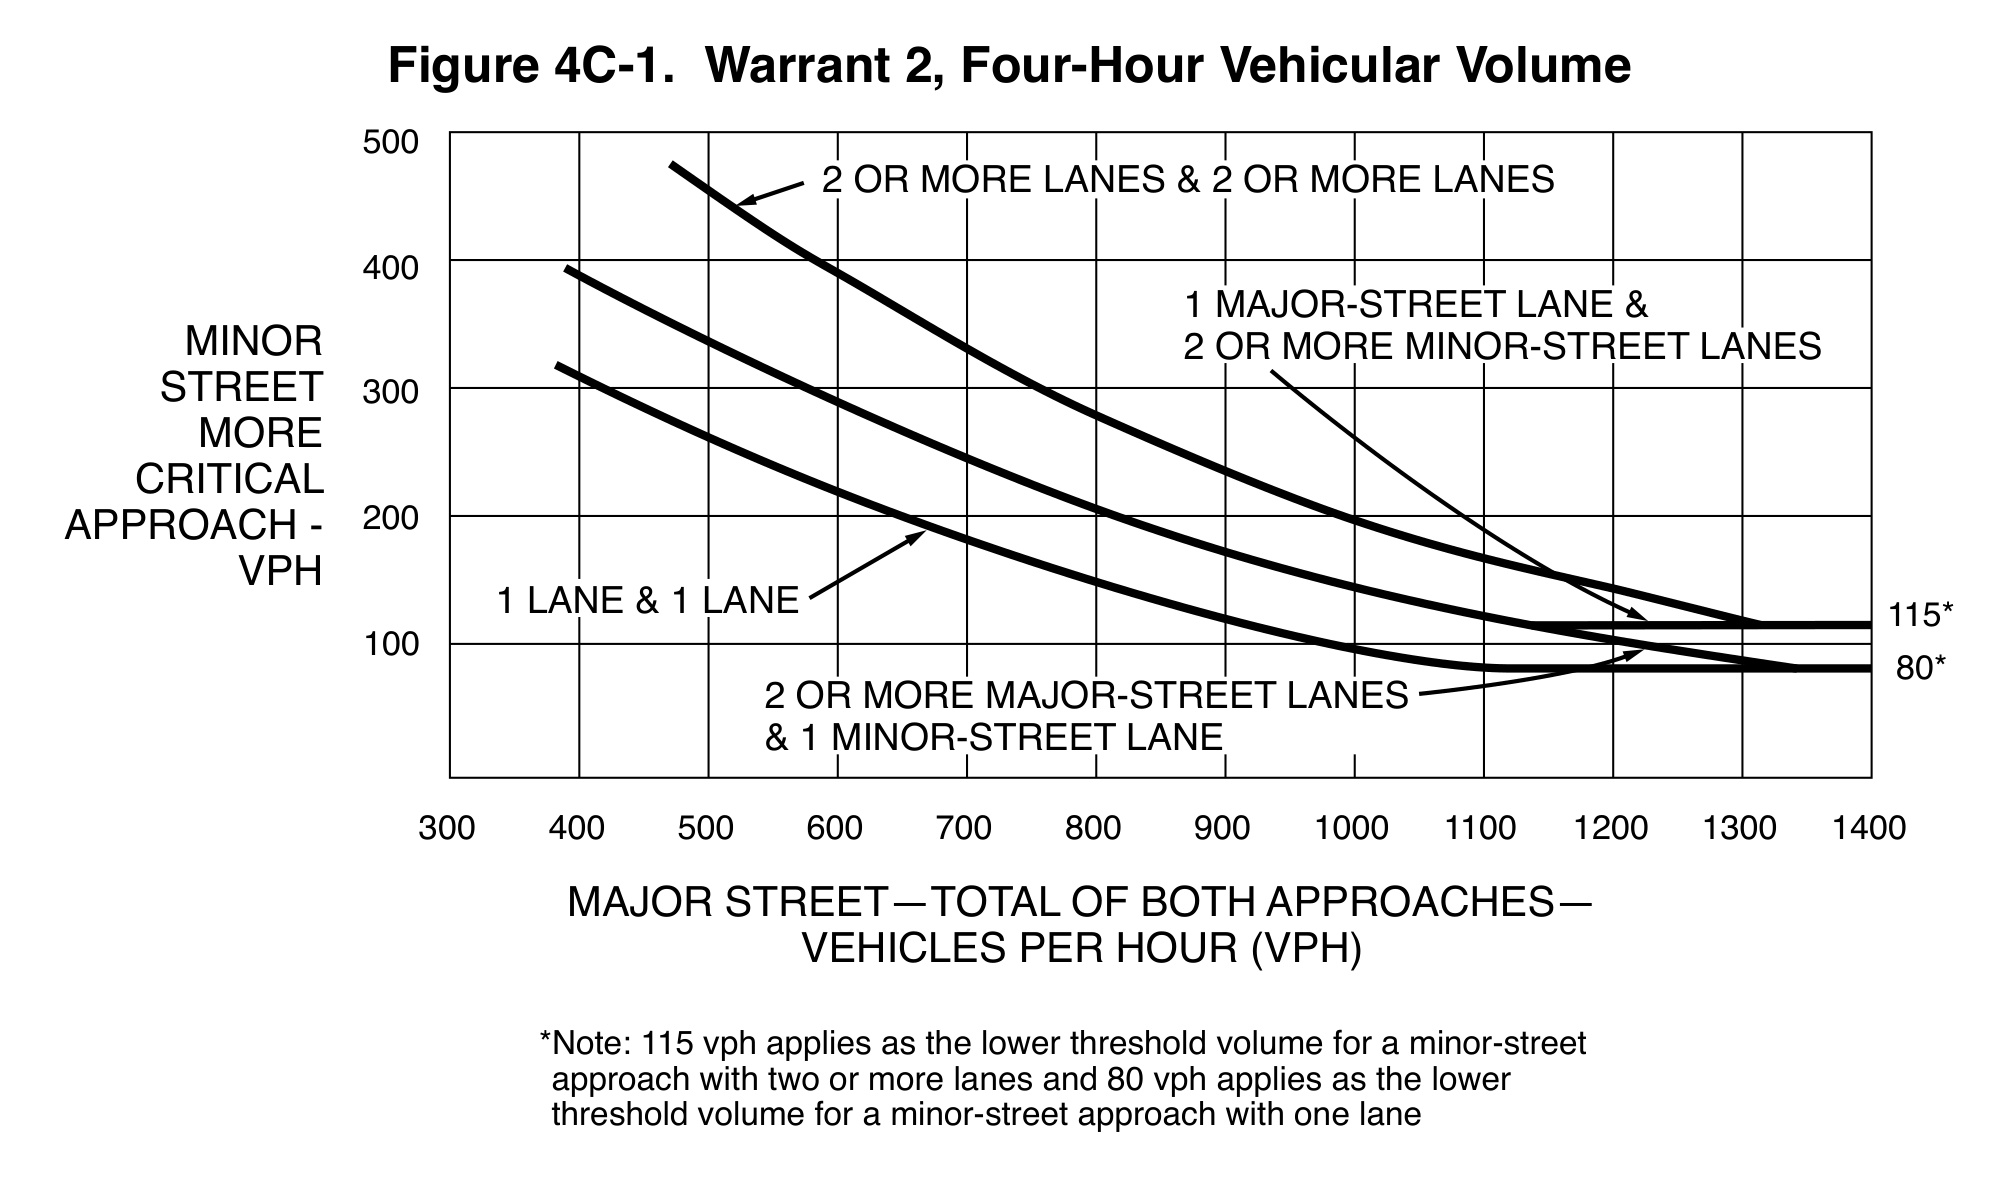
Figure 4C-1 contains different curves for the approach-lane combinations. Select the combination before judging the point. The lower threshold notes are also part of the figure: a minor approach with two or more lanes has a different floor from a one-lane approach. Those floors do not replace the sloping portion of the applicable curve.
A point near a line deserves better documentation, not a thicker marker. Preserve the count, the selected curve and any numerical interpretation used by the agency. If rounding or a lane-classification decision changes the conclusion, identify that sensitivity in the study rather than hiding it behind a simple “pass.”
When the 70-percent figure is available
Figure 4C-2 is an optional alternative when the major street’s posted or statutory speed limit, or its 85th-percentile speed, exceeds 40 mph. It is also available where the intersection lies within the built-up area of an isolated community with fewer than 10,000 people. “Small town” without the isolation and built-up-area context is incomplete documentation.
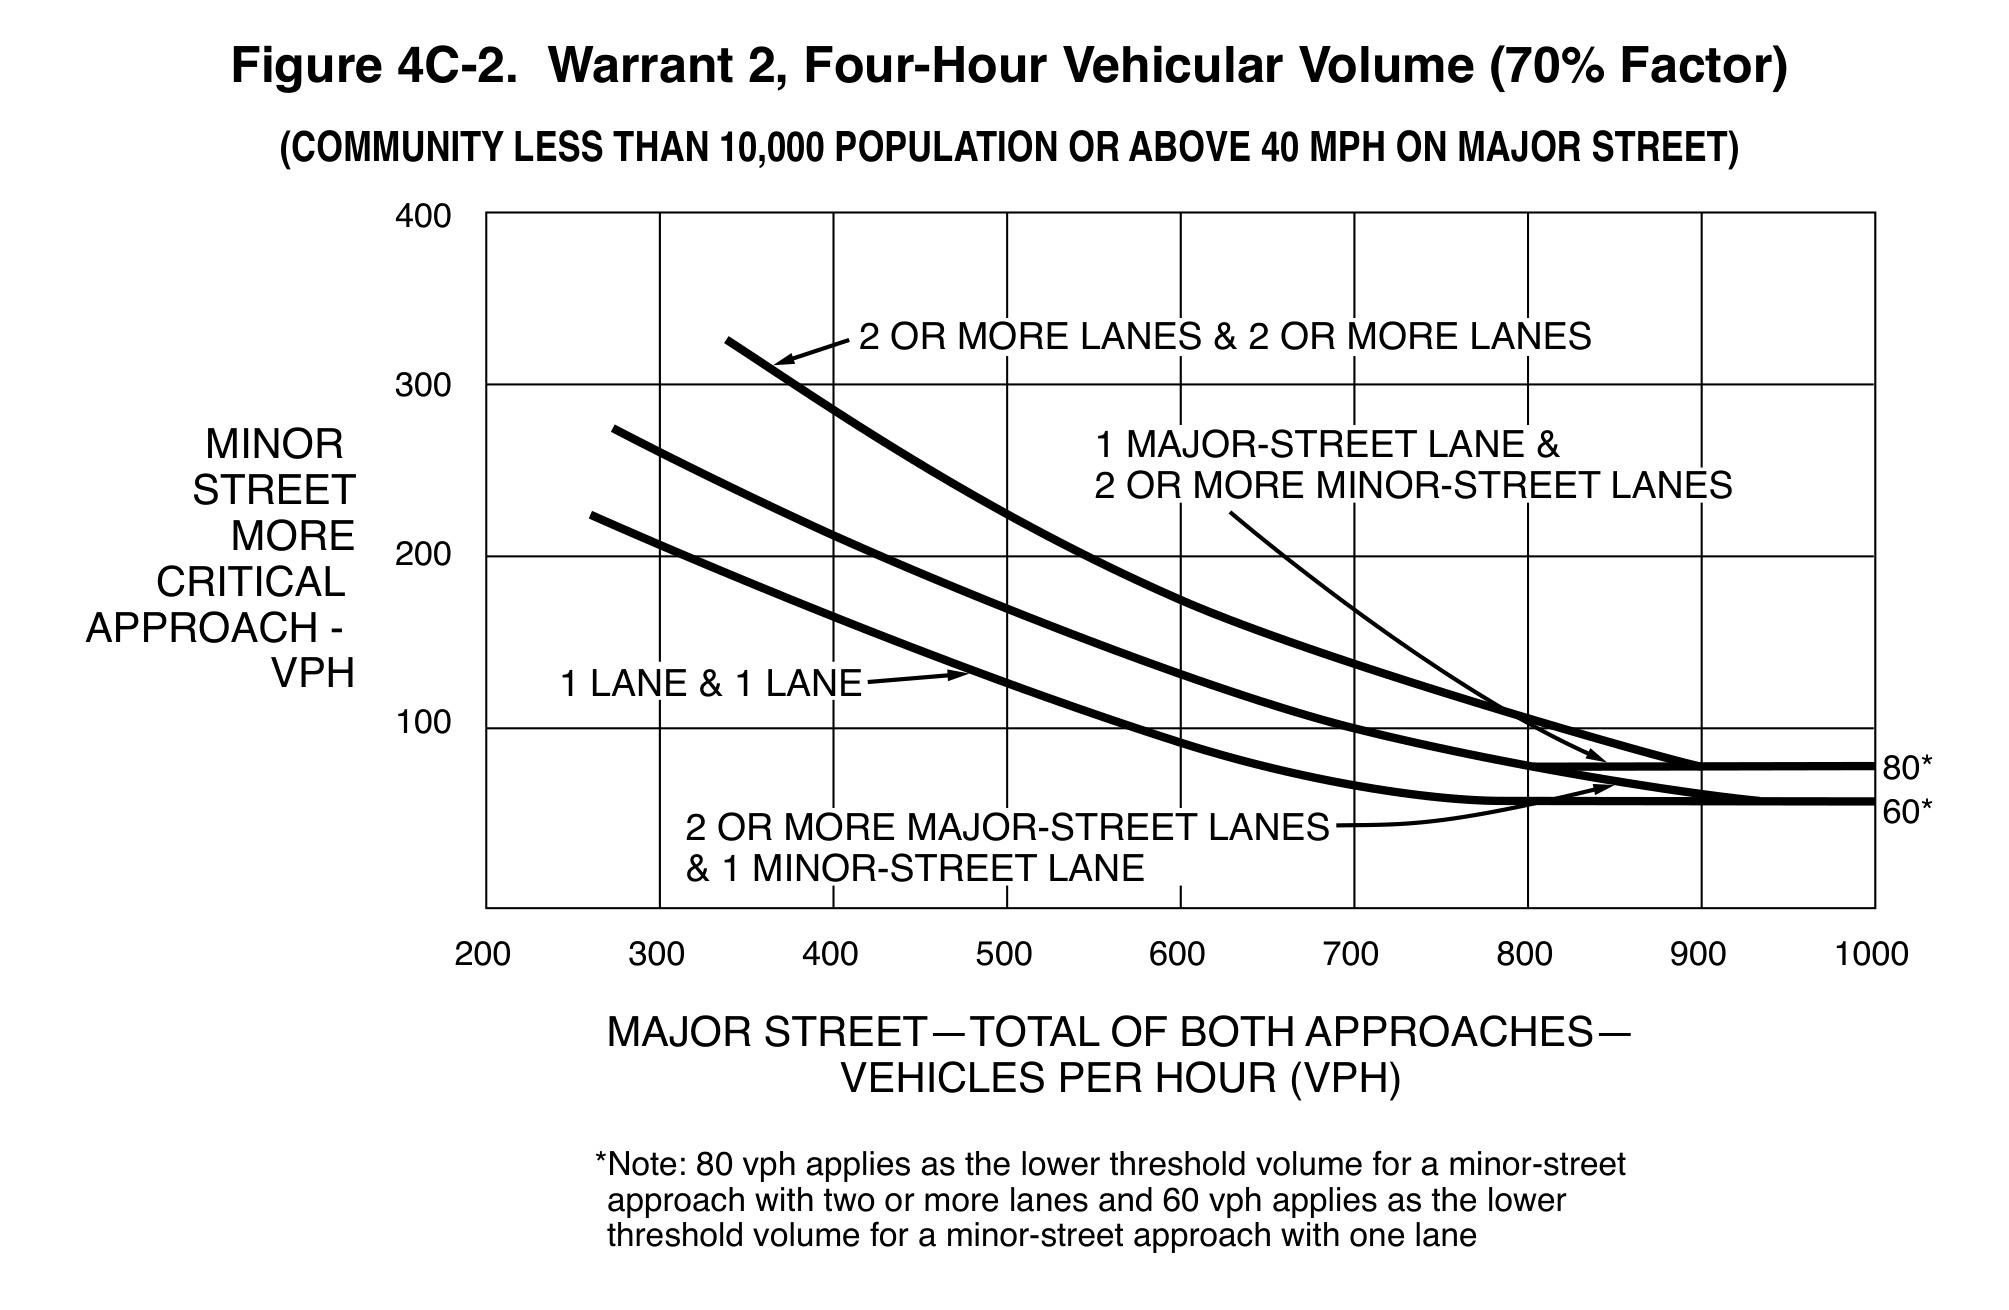
Record the actual basis: speed measure, value and date, or the qualifying community information. A posted 40 mph limit alone does not satisfy “exceeds 40 mph.” Conversely, a documented qualifying 85th-percentile speed is one of the measures named in the provision. The study should say which measure supports the choice.
Use the alternative figure as published, including its lower thresholds. Do not plot on that figure and then reduce its values again by 30 percent. Also keep this procedure separate from Warrant 1’s eight-hour tables and combined-condition factors. Similar percentages in different warrant procedures are not interchangeable calculation steps.
The peak-hour warrant has a narrower purpose
Warrant 3 addresses undue delay on a minor approach during at least one hour of an average day. Section 4C.04 says it should be applied only in unusual cases, such as large generators that attract or release many vehicles over a short period. An ordinary afternoon peak is not, by itself, the explanation for choosing this warrant.
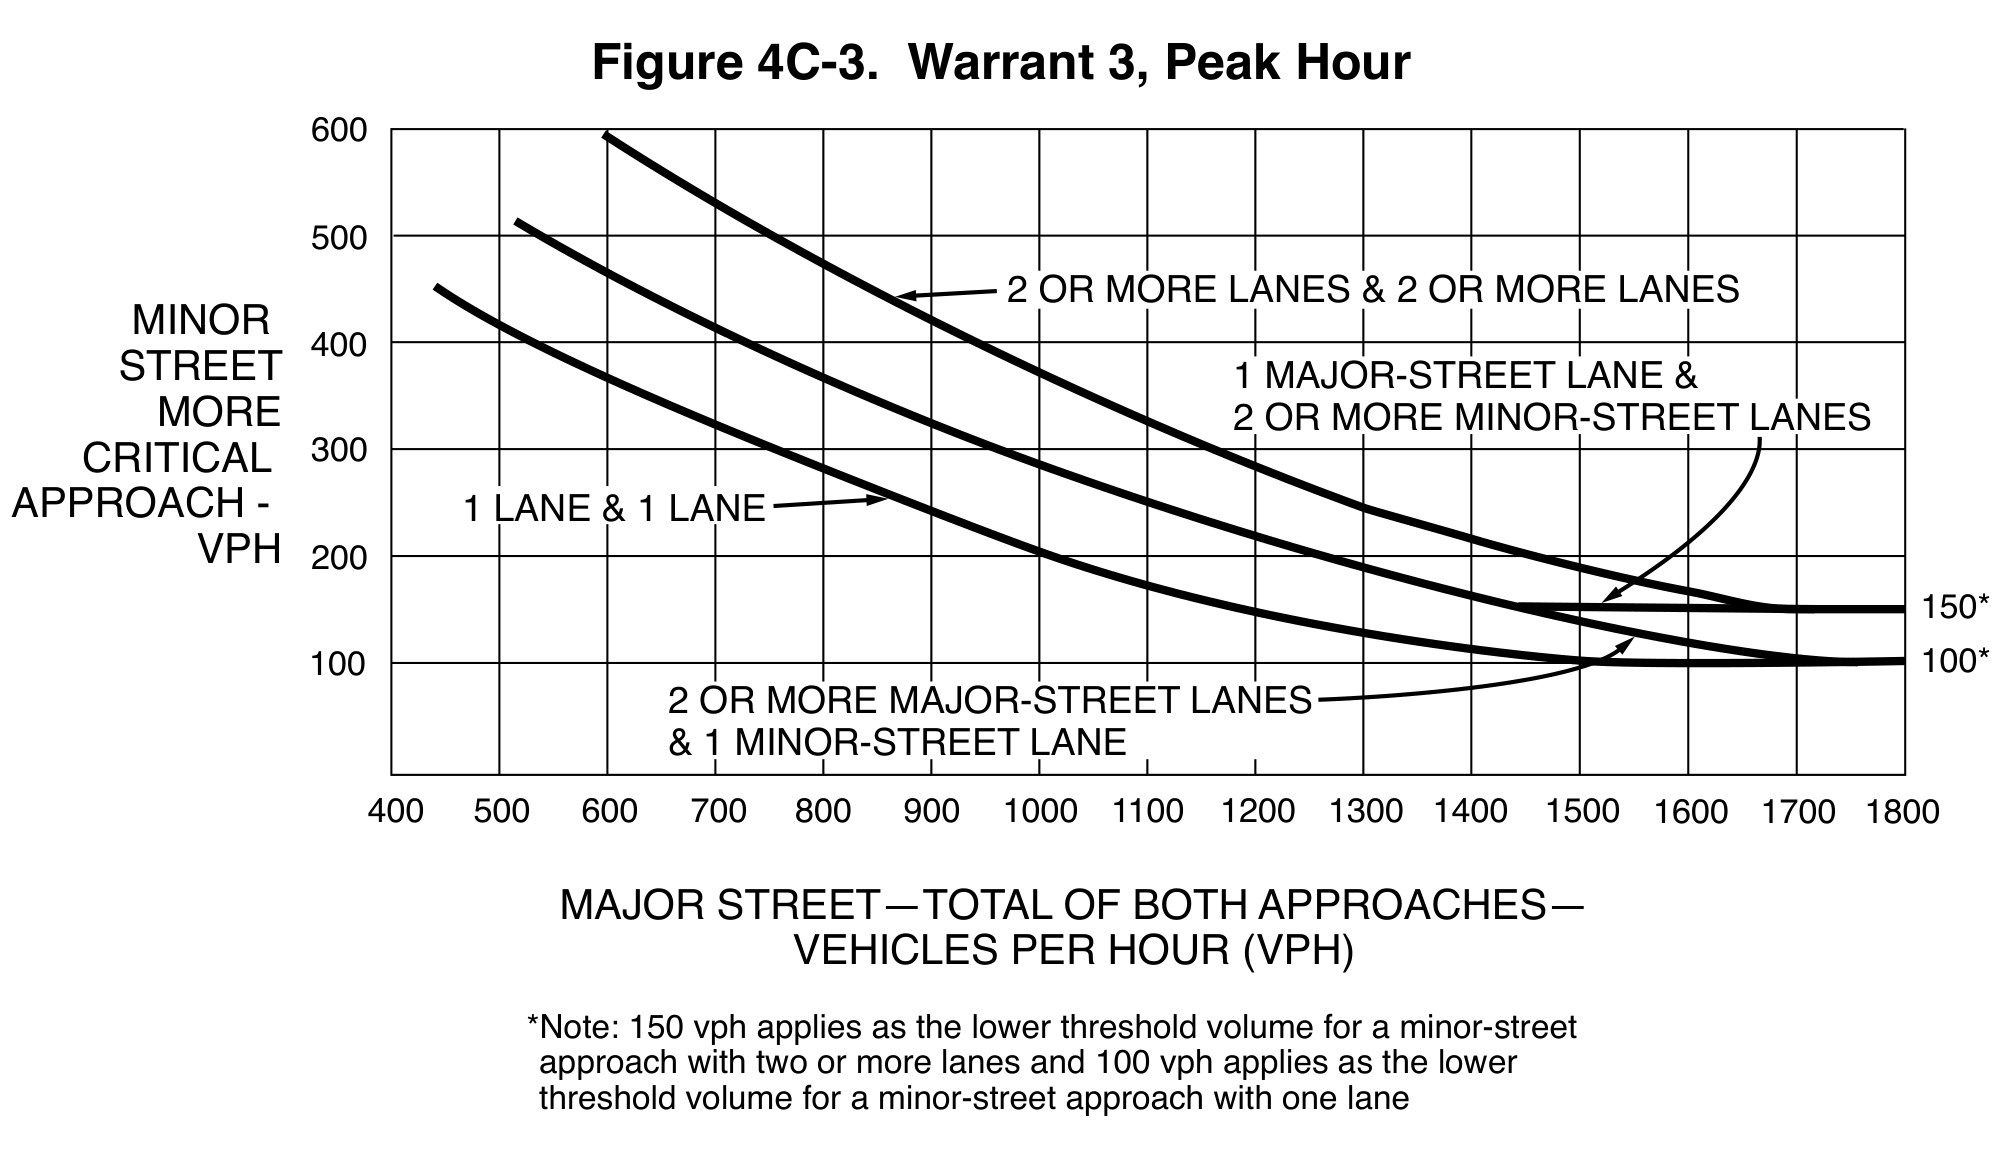
The plotted-point route uses one corresponding hour and Figure 4C-3’s lane-specific curve. There is also a separate route requiring three conditions together: stopped-time delay on one STOP-controlled minor approach, minimum volume on that same approach, and minimum total entering volume. A study should identify the route it evaluated rather than mixing its most favorable pieces with the chart route.
For the delay route, the thresholds are 4 vehicle-hours for a one-lane minor approach or 5 for two lanes; minor volume must be at least 100 or 150 vehicles per hour respectively. Total entering volume must reach 650 vehicles per hour for three approaches or 800 for four or more. All three conditions apply to the same hour.
Vehicle-hours are accumulated delay, not the longest wait
A hypothetical one-lane minor approach serves 120 vehicles during the study hour. If their measured stopped-time delay totals 14,400 vehicle-seconds, that equals 4 vehicle-hours. The average is 120 seconds per vehicle, but the underlying observations could include very different individual waits. This arithmetic illustrates the delay unit; it is not an observation from a LEOTEK installation.
That delay total and 120-vehicle approach volume still do not complete the three-condition route. The corresponding total entering volume must also qualify, and the unusual-case context remains relevant. Adding waiting time before the selected hour, or treating travel time through the corridor as stopped-time delay, would change the measure.
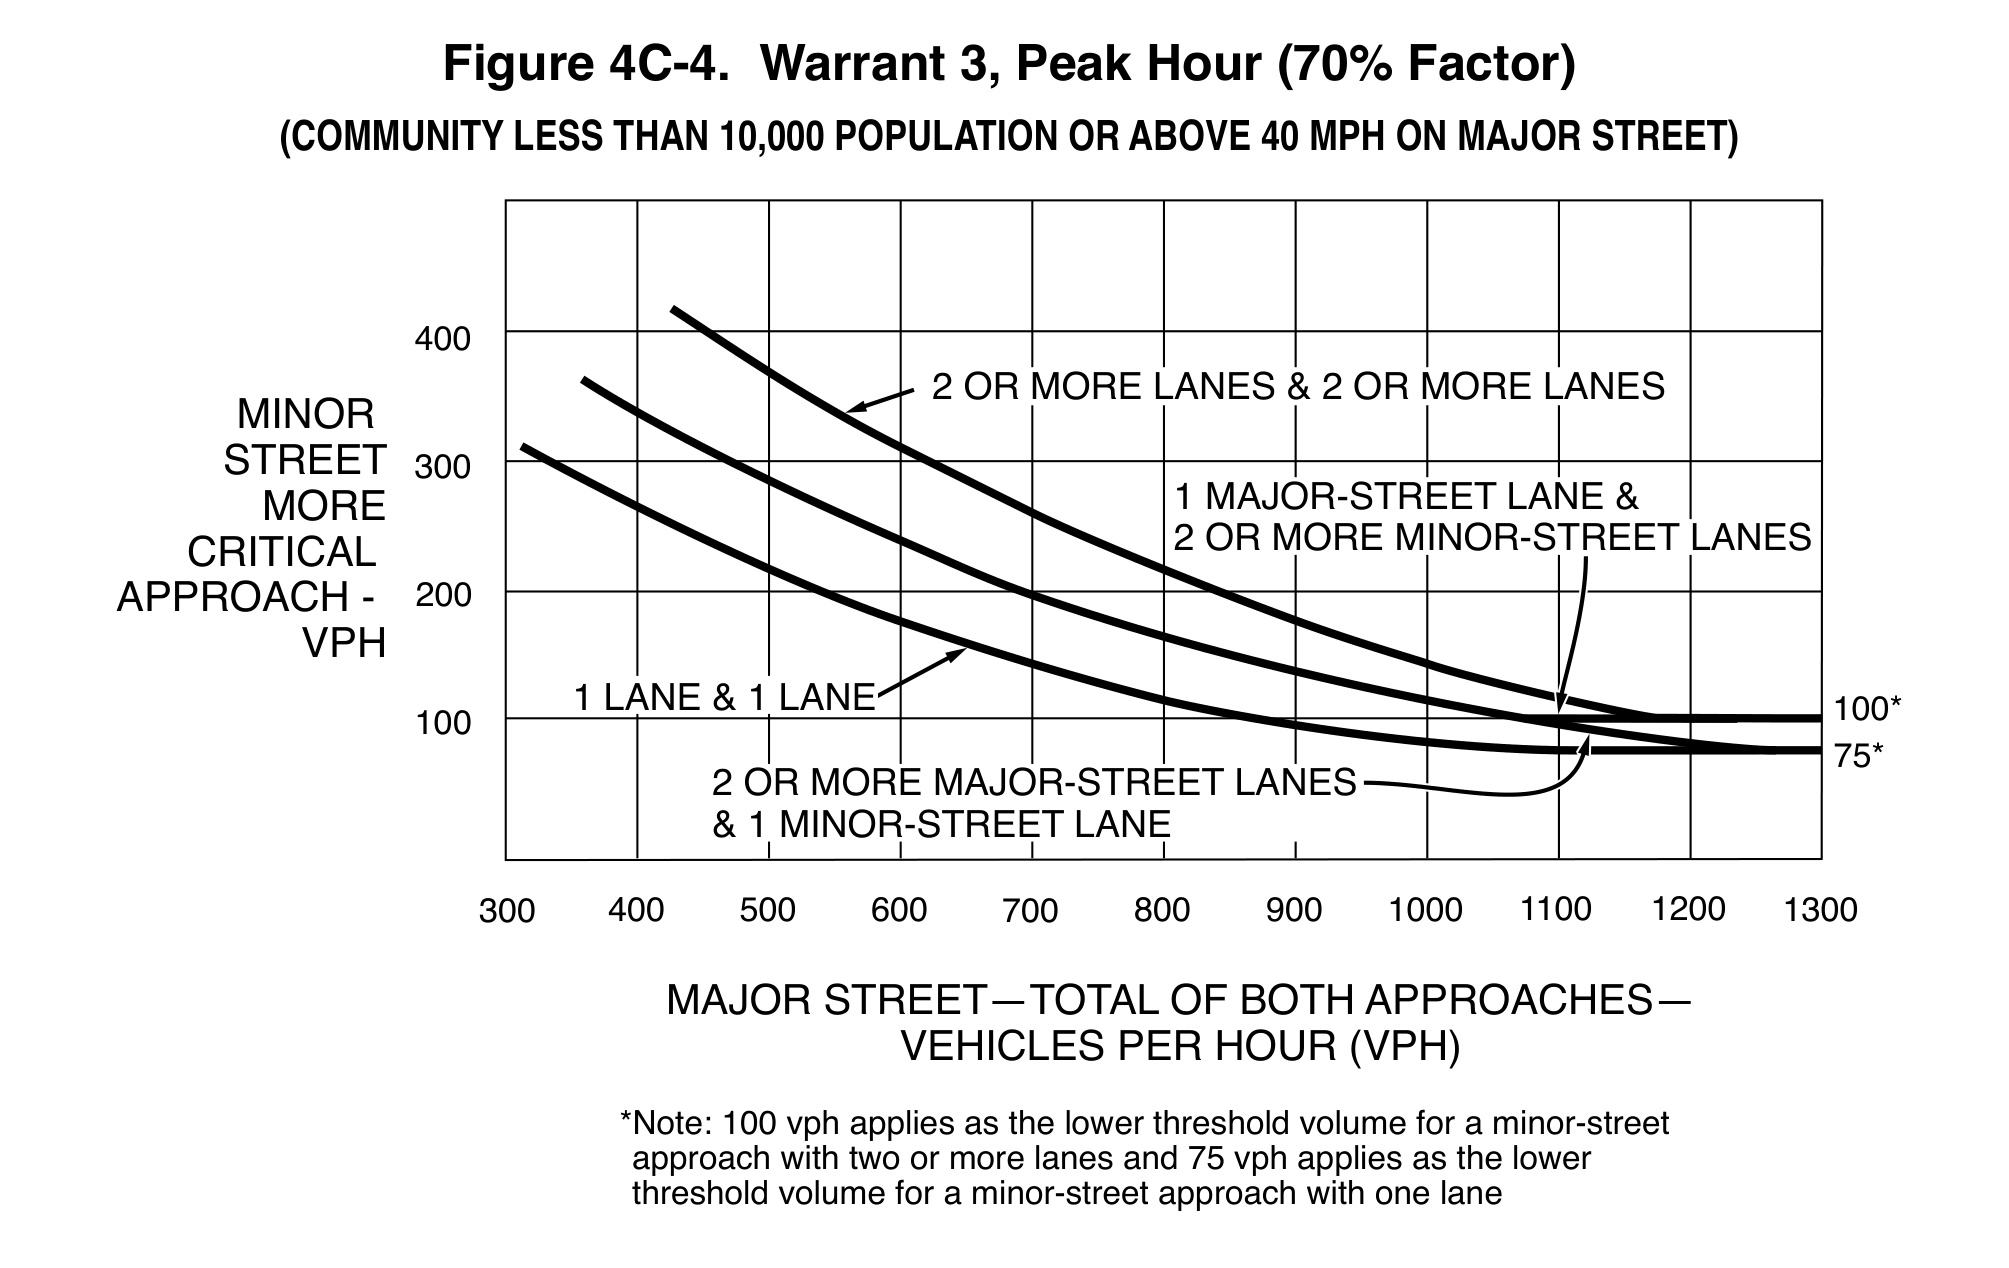
Figure 4C-4 is the alternative peak-hour chart under the same qualifying speed or isolated-community conditions described in Section 4C.04. Its lower thresholds differ from the ordinary chart. This alternative applies to the plotted-point route; it does not authorize an improvised 70-percent reduction to every number in the separate delay route.
Lane classification deserves an explicit decision
A striped turn lane is not simply another lane to count without examining how it operates. Section 4C.01 discusses engineering judgment for separate turn lanes, right turns and the more critical minor approach. Depending on the conflicts, some right turns may be excluded. The calculation should state what was counted and why.
The critical minor approach can also change between hours. With different lane arrangements, the largest raw approach count is not necessarily the governing one. Retain both approaches in the count record and explain the selection for each evaluated period. Otherwise a later reviewer may reasonably reach a different chart choice from the same field data.
A warranted signal still needs a design decision
Section 4C.01 expressly separates meeting a warrant from requiring installation. The engineering study should examine alternatives and whether a signal improves overall safety and operation. It also recognizes documented engineering-study justification where no warrant is met. A “warrant not met” result therefore needs interpretation, rather than being treated as permission to ignore an identified crossing or access problem.
After justification, design questions remain: lane assignment, signal visibility, detection, pedestrian service, timing, coordination, power and maintenance. Buying a brighter module cannot correct a poor face location or a missing detection strategy. The warrant study and the equipment submittal should remain connected, but they serve different purposes.
A useful project handover contains the dated raw counts, site diagram, speed basis, plotted hours, lane assumptions, delay observations where applicable, alternatives considered and signed recommendation. Retain the manual edition and the responsible agency’s applicable procedures. That record explains the decision long after the original spreadsheet author has moved on.
What to do with a borderline fourth hour
Suppose three hourly points are comfortably above the selected four-hour curve, while the fourth is just below it. The honest result is that this four-hour test has not been satisfied by those observations. A spreadsheet should retain that result. Moving to the alternative chart requires its stated eligibility conditions, not disappointment with the ordinary chart.
The next useful question is whether the count represents the operating condition under review. Check missing intervals, temporary closures, day selection and the lane assumptions. If a repeat count is needed, document the reason and preserve both datasets. Repeating observations only until one day produces a desired answer gives the reviewer less confidence, not more evidence.
Keep the broader engineering conclusion separate. A measured crossing conflict, unusual generator or another applicable warrant may still warrant investigation. Conversely, four qualifying points do not show that downstream storage, coordination or pedestrian access will work after installation. The strongest study makes both the numeric result and the remaining design questions easy to find.
Frequently asked questions
Can one very busy hour satisfy the four-hour warrant?
No. Warrant 2 evaluates four corresponding hourly points. A peak-hour evaluation is a separate warrant with its own application guidance and criteria. A strong hour cannot be counted four times.
Do I add both minor-street approaches?
Not for the vertical axis in these figures. It represents the more critical minor approach in one direction. The major-street horizontal axis combines both approaches. Keep the original approach counts so the selection can be checked.
Does a 40 mph sign qualify for the reduced vehicle-volume charts?
Not through the posted-limit condition alone, which says exceeds 40 mph. Review the other named speed measures or the isolated-community condition. Pedestrian-warrant and PHB figures use different provisions; do not borrow their 35 mph threshold.
Can this warrant analysis select an LED signal module?
It establishes neither a model’s approval status nor its electrical compatibility. Once the traffic-control design is established, verify the specific indication, voltage, optics, agency listing and installation requirements in the equipment submittal.
Sources and related reading
- FHWA, MUTCD 11th Edition with Revision 1, Chapter 4C: Sections 4C.01 through 4C.04; Figures 4C-1 through 4C-4, printed pp. 651-657.
- FHWA current-edition record. Federal publication checked October 18, 2026; confirm the responsible agency’s adopted requirements for an actual project.
- Traffic signal viewing angle: evaluate the driver’s position.
Continue the crossing-design review
- When Does a Pedestrian Crossing Need a Signal? Reading the MUTCD Volume Warrants
- PHB or RRFB? Match the Crossing Treatment to the Control People Need
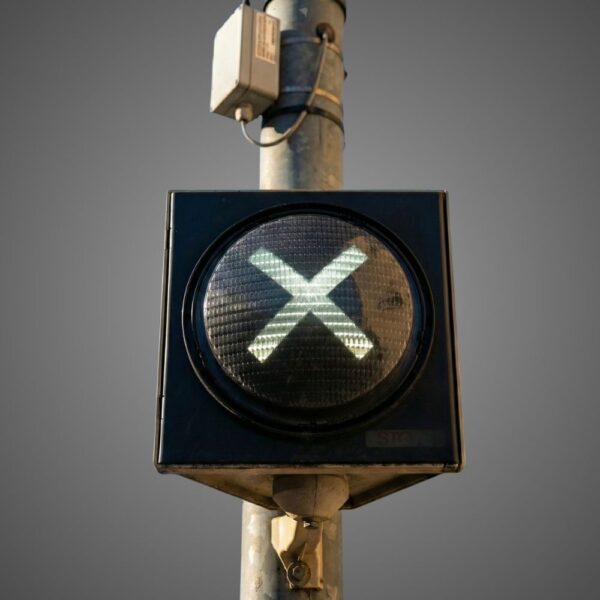
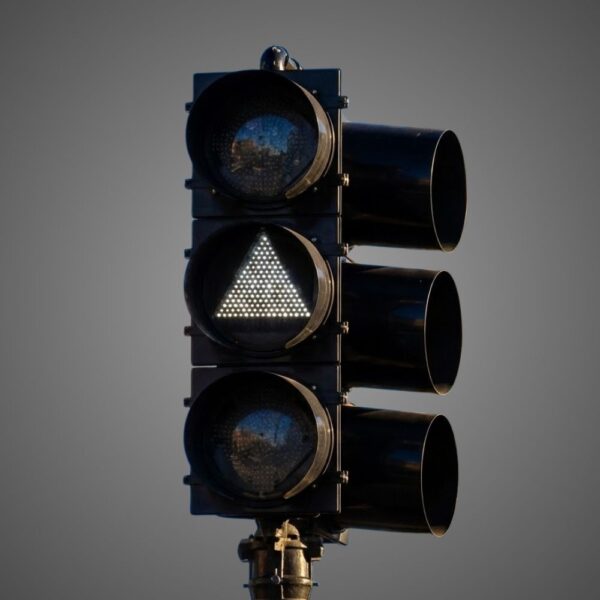
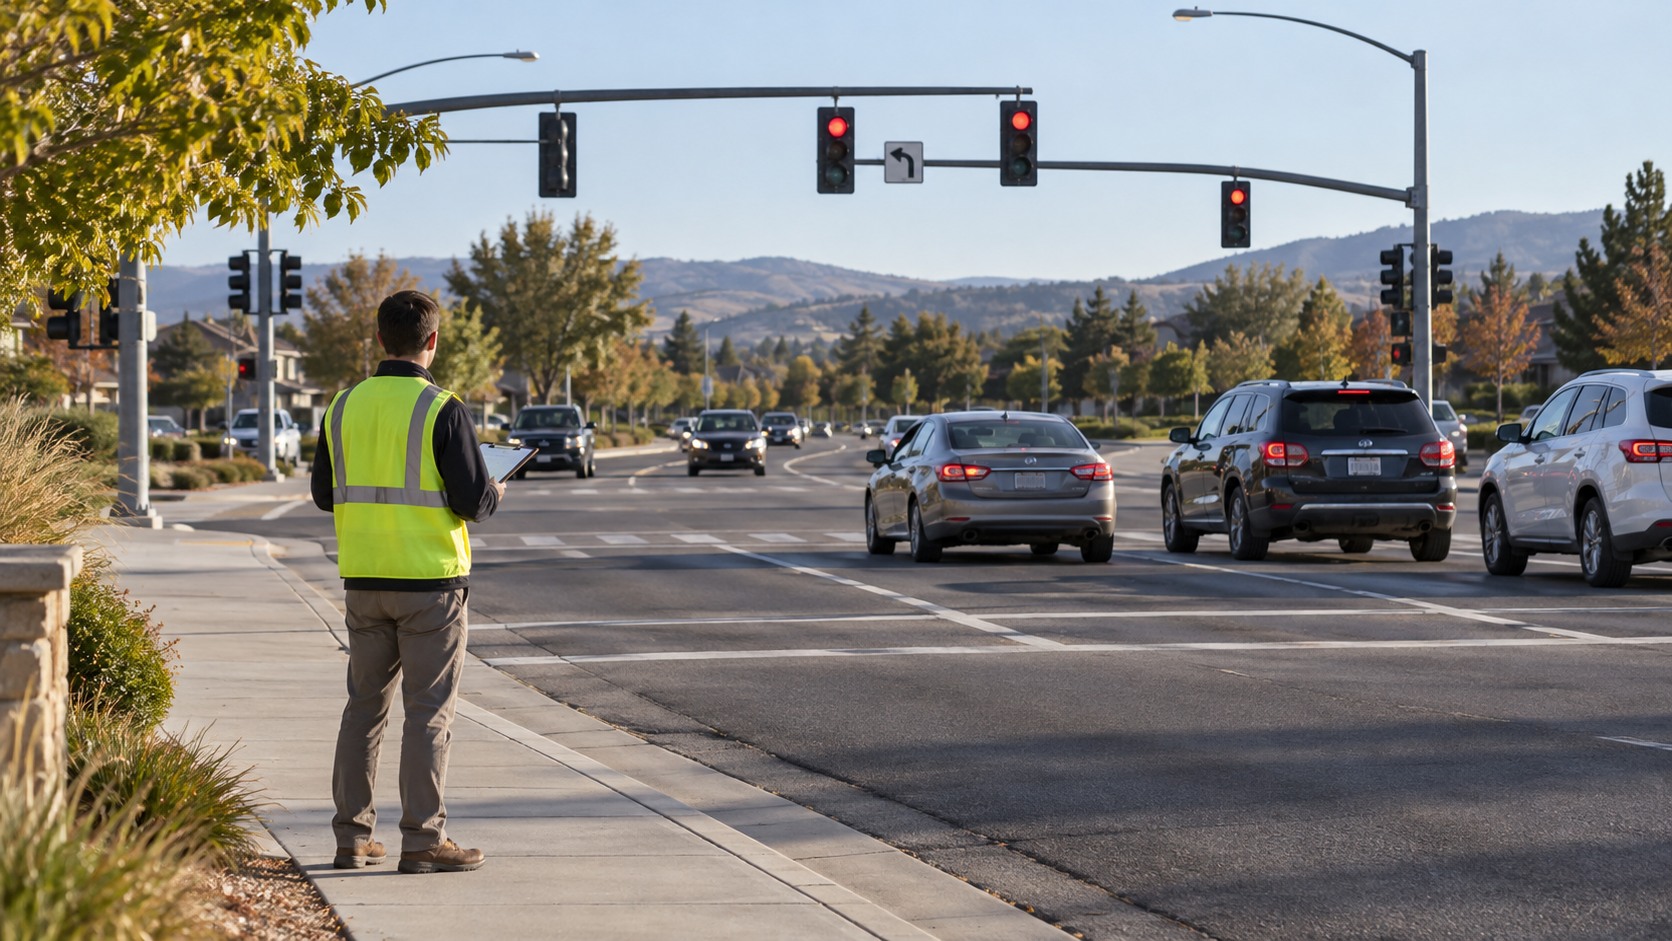
Cover: AI-generated editorial illustration for LEOTEK, not a verified installation or product photograph. Technical figures: FHWA/MUTCD originals, individually credited above.