

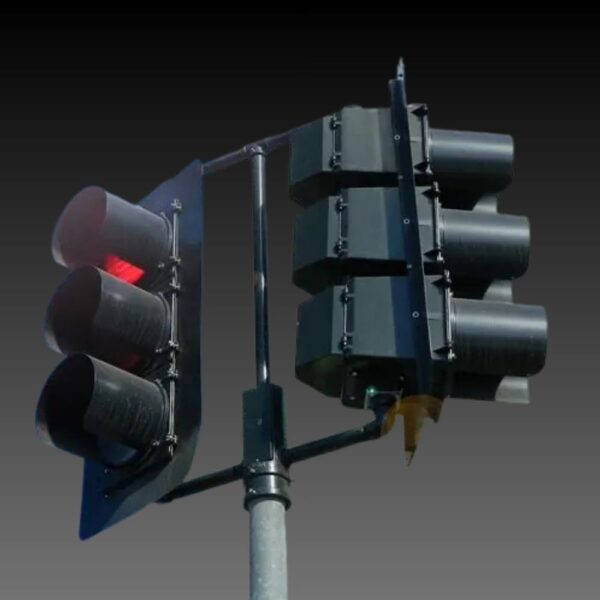


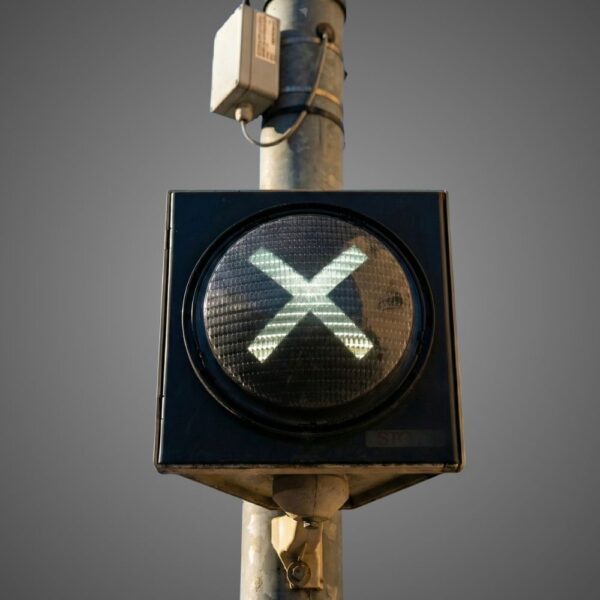
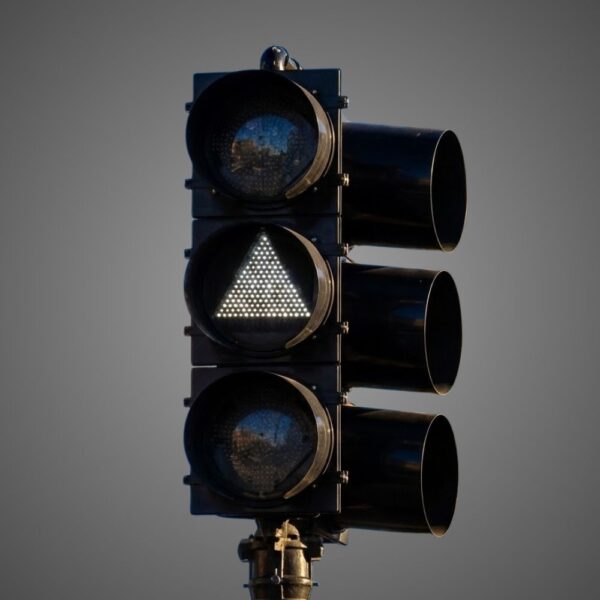


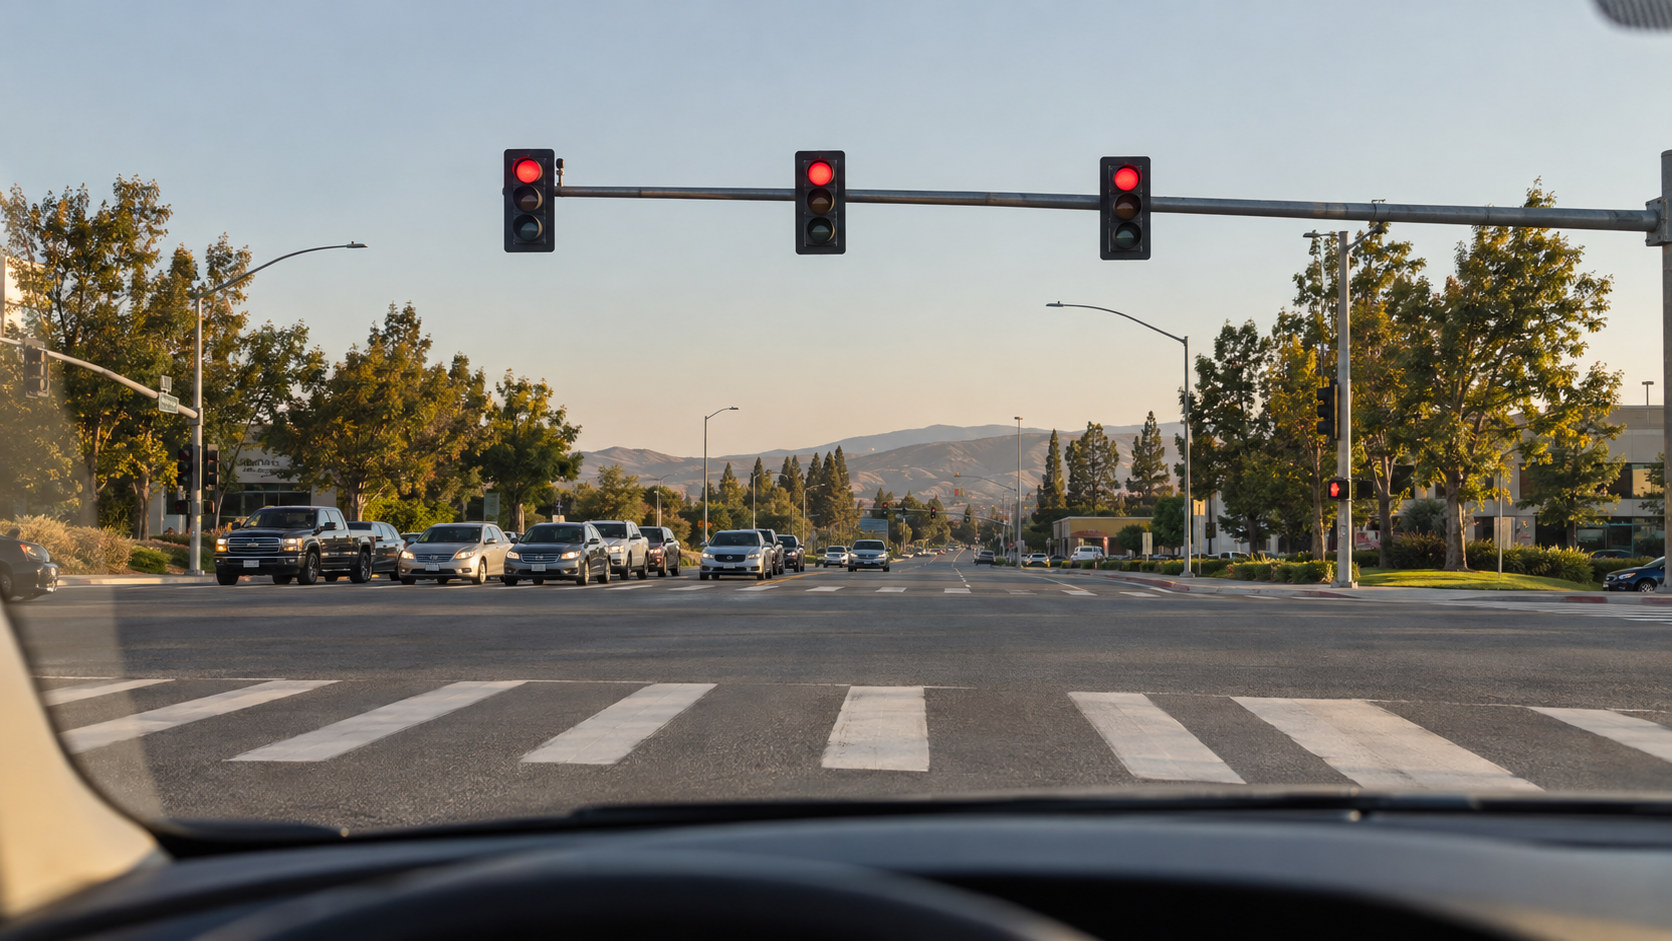
A driver in an offset lane does not observe a signal from the same direction as a driver centered on the approach. That is why a single centerline value is an incomplete answer to a viewing-angle question.
Begin with the positions the installation needs to serve. Then compare the relevant angular evidence and the head's installed orientation, including any visor or visibility-control hardware.
Separate the module from the installation
The module's photometric distribution describes its output under a test arrangement. The installed head, aiming, obstruction and approach geometry determine which part of that distribution is relevant to a driver.
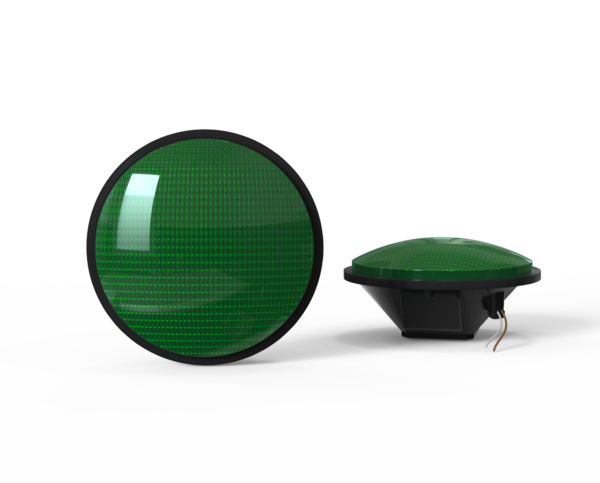
A wider-viewing-angle feature claim therefore needs context. Ask for the required horizontal and vertical data rather than treating one brochure phrase as proof of visibility from every lane or location. The reviewed LEOTEK sheets state a wider-angle feature but do not replace a project-specific geometry review. (LEOTEK IL6-P3 10-28 Vdc specification; LEOTEK SPC 80-135 Vac specification)
A historical study used different viewing positions
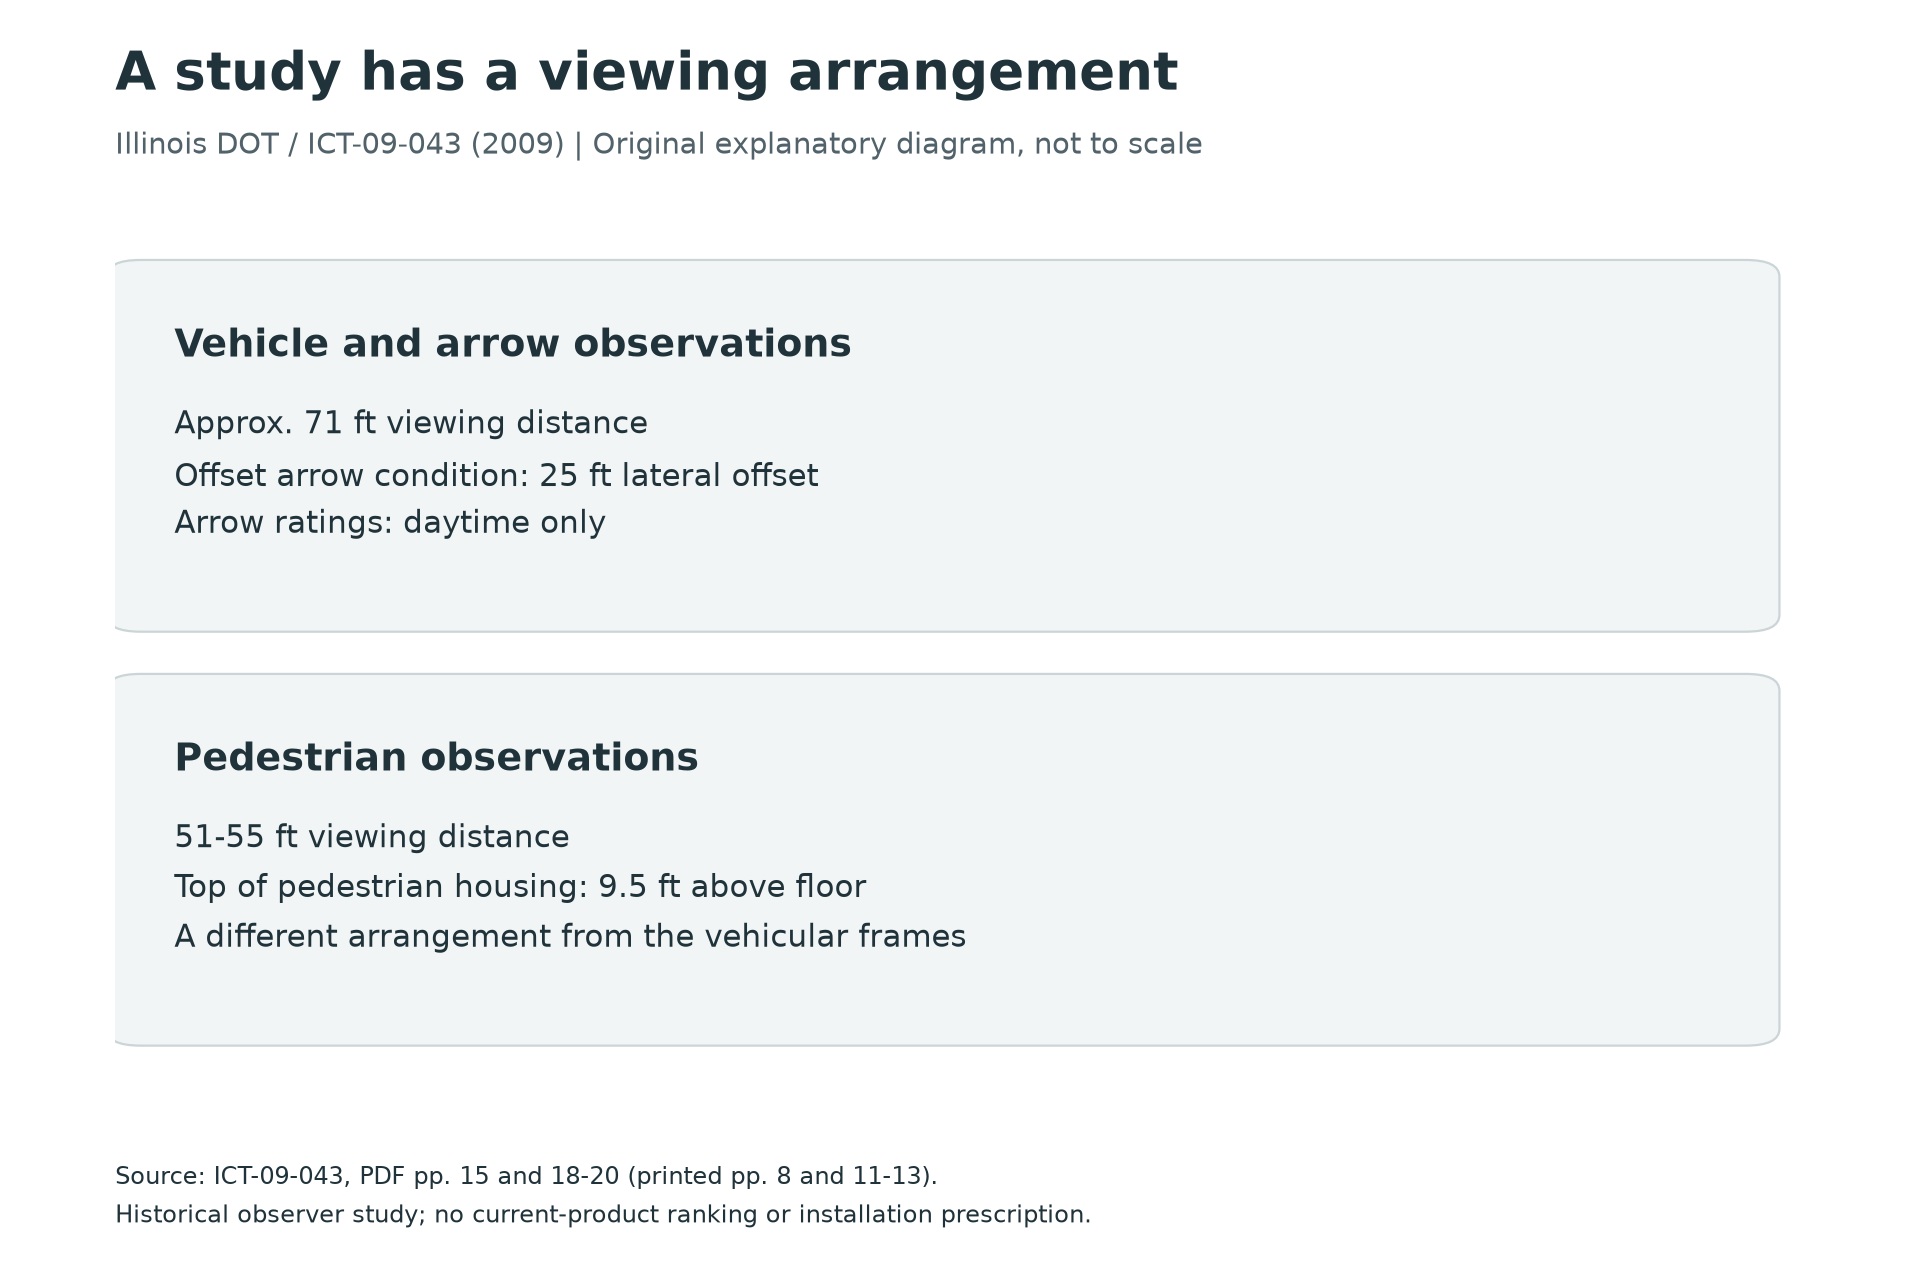
The Illinois 2009 evaluation included straight and offset viewing for arrow modules. Its method describes approximately 71 feet of viewing distance and a 25-foot lateral offset for the angled condition. Arrow testing was conducted in daylight, unlike portions of the circular-module evaluation. (Illinois DOT / ICT-09-043 (2009))
Those are study conditions, not a beam-angle specification or a rule for signal placement. The tested historical model numbers also cannot be relabelled as current IL6-P3 performance.
Compare like positions and conditions
For each candidate, retain the indication, orientation, lens, supply, relevant measurement positions and required criterion. A table with different angular conditions in adjacent columns is not a like-for-like comparison.
Field photographs can document what a driver sees from an identified location. Preserve the position and camera conditions, and keep that observation separate from laboratory photometry. Do not infer universal nighttime performance from a daylight photo.
| Indication | Viewing arrangement | Study boundary |
|---|---|---|
| Vehicular modules | Approximately 71 ft viewing distance | Laboratory arrangement; modules mounted approximately 16 ft above the floor |
| Arrow modules | Straight and offset viewing; 25 ft lateral offset described | Daytime only; the report describes approximately 71 ft viewing distance |
| Pedestrian modules | 51-55 ft viewing distance; top of housing 9.5 ft above floor | Different geometry from the vehicular-module arrangement |
Study conditions explain what the observer ratings cover. They are not installation dimensions or a current-product photometric qualification.
Source: Illinois DOT / ICT-09-043, April 2009; PDF pages 15 and 18-20 / printed pages 8 and 11-13. Read the original government source.
Historical modules and observer ratings. Arrow modules were evaluated in daytime only. Do not infer nighttime arrow performance or a present-day LEOTEK model ranking.
Make the technical inquiry specific
Instead of asking whether a module has a 'good viewing angle,' identify the approach, affected lane or offset position and the intended indication. Ask which test data address that geometry and which installation details need review. The answer becomes a design discussion rather than an unsupported comparison of marketing numbers.
Read the approach as a changing geometric problem
A driver does not remain at a single test position. Longitudinal distance decreases, lateral offset may change with lane position, and the signal's apparent location changes relative to surrounding objects. A useful review therefore considers the path and the relevant decision points rather than selecting one convenient location for a photograph. The applicable manual and agency design establish the requirements; a viewing sketch helps the team discuss them.
For an illustrative calculation, hold lateral offset at 20 feet. At 150 feet longitudinal distance the horizontal angle is approximately 7.6 degrees; at 75 feet it is 14.9 degrees. Calculate angle as arctan(offset/distance). These numbers are geometry examples, not permitted mounting limits or visibility acceptance thresholds. They demonstrate why a single straight-ahead observation cannot describe all approach positions.
Vertical geometry deserves its own record. A mounting height and a vehicle's eye position create a vertical angle as well as a horizontal one. This is not a reason to invent a universal head-tilt rule. It is a reason to ask whether the actual installation and the required optical evidence describe the same relevant directions. MUTCD provides the governing national traffic-control context; agency requirements may add project-specific detail.
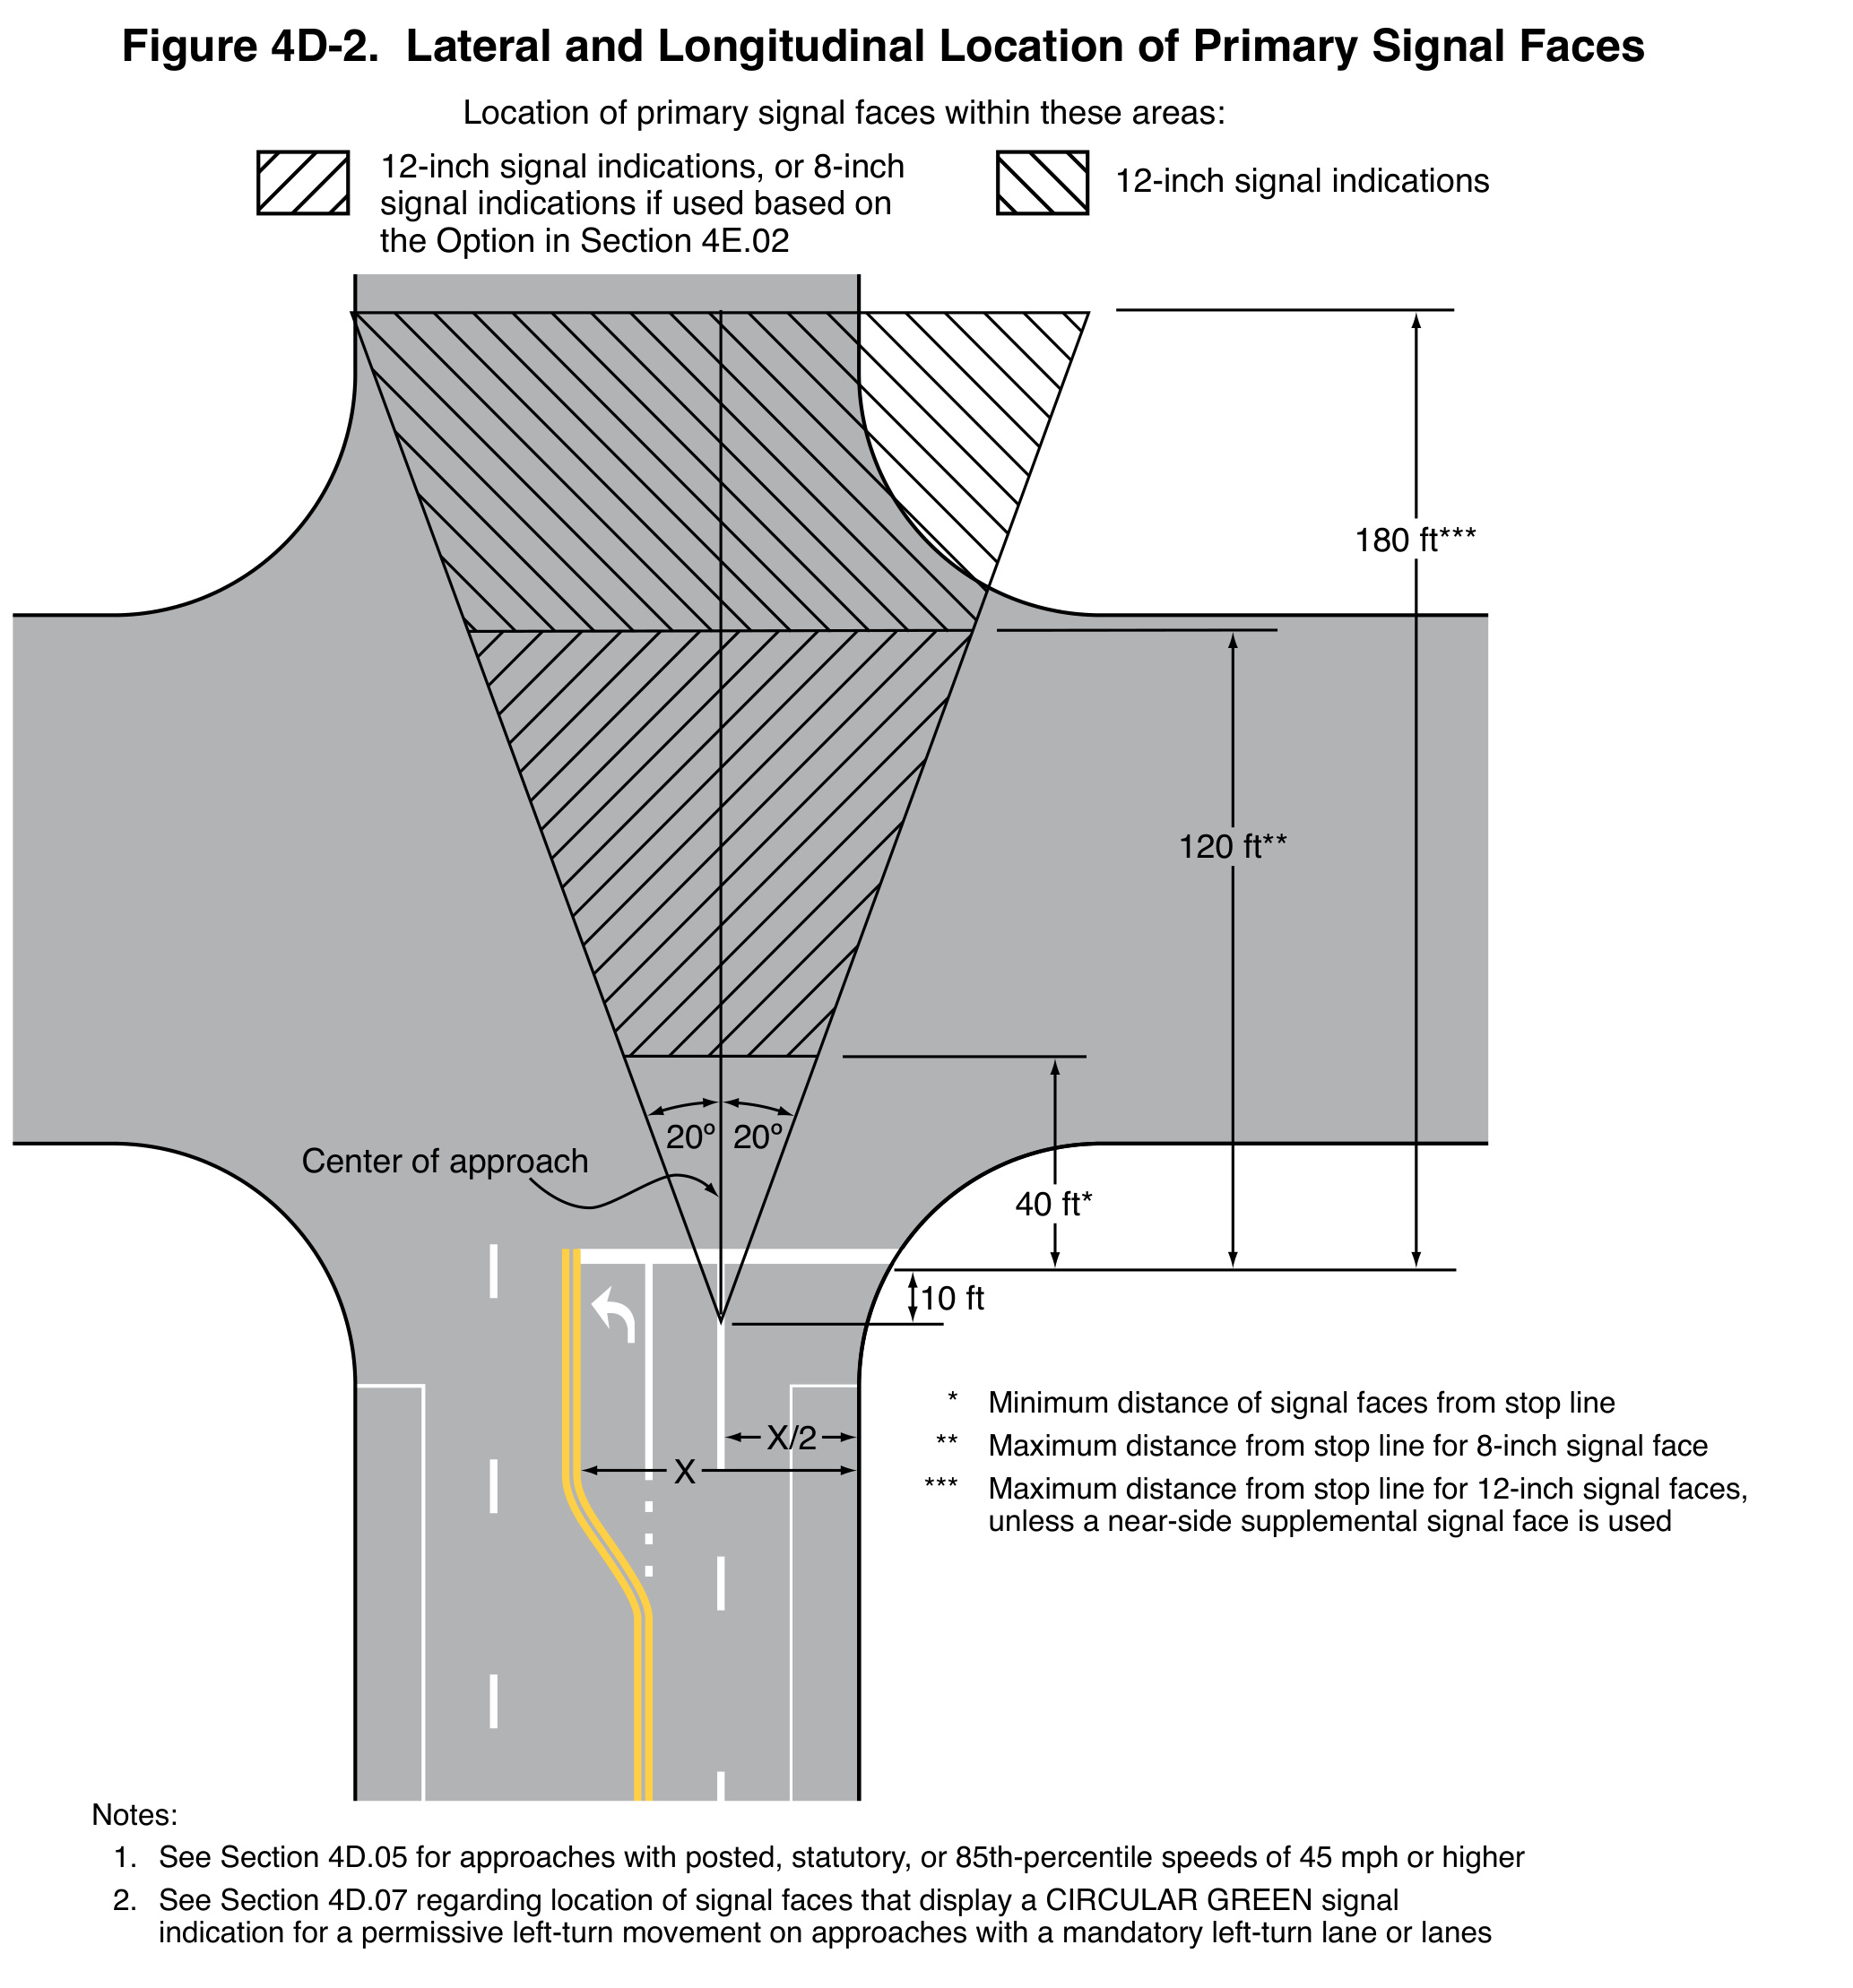
The hatched areas relate forward distance to lateral placement of the primary faces. They are installation geometry, not a manufacturer's optical beam pattern. The legend also limits the use of an 8-inch indication to the applicable Section 4E.02 option. A visibility review therefore needs both the permitted physical location and the directional performance relevant to the driver's position; a favorable answer to only one does not establish the other.
What was controlled in the Illinois comparison?
The historical Illinois research documented vehicle-module observations at a 71-foot viewing distance with a 25-foot lateral offset. Its pedestrian observations used a different setup. Those details matter because a study conducted at one position answers a narrower question than an unrestricted claim about every driver's view. The diagram in this article makes that boundary visible. See the original Illinois report, including the methods and setup descriptions.
There is also a difference between an observer rating and an optical acceptance test. An observer can report that a face appears bright or uniform. A photometric procedure measures a defined quantity under defined conditions. Both can contribute to a discussion, but substituting one for the other discards information about how the result was obtained. A product comparison should identify which type of evidence is being used before drawing a conclusion.
This distinction is commercially important when a supplier offers a persuasive field photograph. Ask where the camera was, which modules were compared, whether conditions were comparable, and what the photograph is intended to establish. It may document a visible installation issue well. It cannot, by itself, establish every specified angle or predict performance outside the recorded conditions.
Background contrast and aiming are different interventions
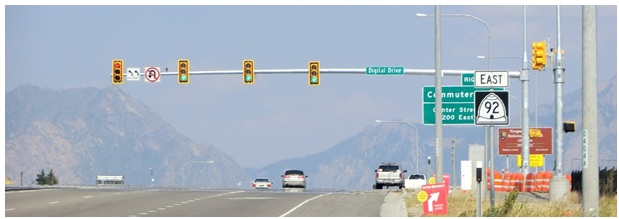
The FHWA approach photograph included here is useful context for discussing signal visibility against the surrounding scene. It is not a manufacturer comparison or a measured improvement for the particular installation. A darker background immediately around a head and a correctly aimed optical distribution address different parts of the viewing problem. One should not be treated as an automatic substitute for the other.
Begin a field review by recording the observation position and the concern: obstruction, competing background, apparent face brightness, ambiguous indication, or a difference between lanes. The remedy must follow the identified issue. Increasing output does not remove a physical obstruction, and moving the camera does not establish that a driver's position has been resolved. Changes to the installation belong within the agency's design and maintenance process.
Visibility limiting belongs to the complete signal head
The handbook places an optically programmed signal beside a signal fitted with louvers. Both examples make the intended viewing direction visible. A signal that should serve one approach may need to limit the view from another approach, rather than maximize visibility in every direction.
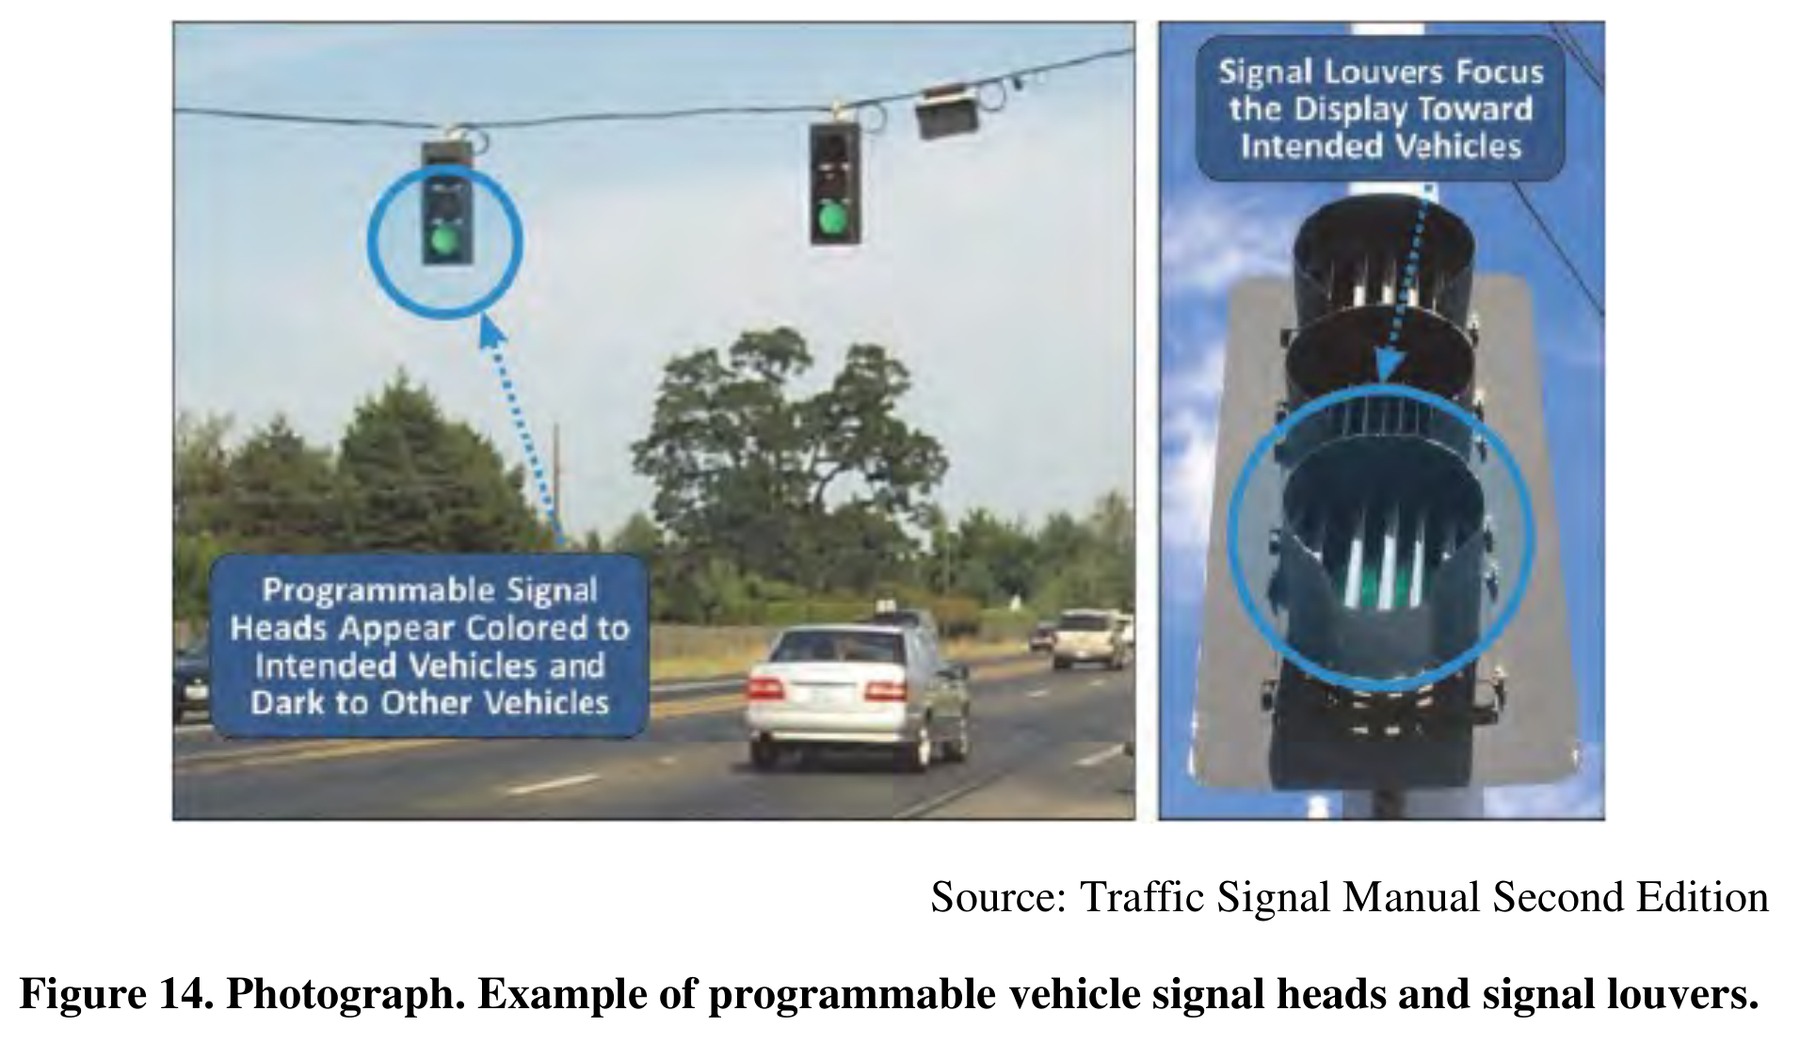
The left photograph illustrates an indication intended to appear illuminated to its own traffic and dark to other traffic. That intentional restriction should not be mistaken for a failed LED module during an observation from the wrong position.
Record the complete head, any visibility-limiting accessories and its aiming with the approach observation. The photograph does not establish a LEOTEK module’s angular intensity or prove that a proposed assembly meets the project criteria. Use the actual optical data and an agency-approved installation review for those decisions.
An observation plan another engineer can repeat
Prepare a simple approach drawing with labeled observation points. For each point, record lane and travel direction, approximate distance, relevant offset, weather and daylight condition, and the state being observed. Describe any photographs as contextual records. Keep the module configuration, head assembly, aiming information and the relevant performance report alongside the drawing.
Repeatability improves the conversation. Instead of receiving the comment that one signal looks dim, the team receives a location and a condition it can revisit. That makes it possible to distinguish a configuration issue from a viewing-position issue and to request additional measurements when observation alone does not settle the requirement. This proposed documentation method is an engineering aid; it is not a substitute for the applicable signal design criteria or a guarantee of a particular product's performance.
Check the whole path, not only the most convenient observation point
A driver does not remain at one coordinate. As the vehicle approaches, a signal may move from a clear background into visual clutter, pass behind an obstruction, or become visible again from a different lane position. Reviewing only the stop line can miss the point where the driver first needs to identify the correct indication. Conversely, a distant photograph may not show the visibility problem created by a nearby obstruction.
Prepare an approach sketch with a few meaningful observation positions selected by the responsible designer. Record the lane, direction of travel, approximate eye position and what can obstruct the view. The objective is a repeatable description of the problem, not a claim that a handful of photographs establishes complete compliance. Apply the relevant MUTCD provisions and agency design criteria when deciding what the installation must provide.
Two smaller offsets can produce one larger angular displacement
Horizontal and vertical angles are often discussed separately because drawings and photometric tables organize them that way. Geometrically, however, the driver can be displaced in both directions at once. In a simplified straight approach, a source 100 feet ahead, 20 feet to one side and 15 feet above the assumed eye position has a combined transverse offset of 25 feet: the square root of 20 squared plus 15 squared. Its angular displacement from that forward reference is arctan(25/100), approximately 14.0 degrees.
This hypothetical calculation uses a chosen reference axis. It is not necessarily the module's optical-axis angle, because the head may be aimed differently. That distinction is the useful lesson. A roadway plan alone does not establish the complete optical geometry. The vertical profile, mounting and actual aiming must be included before comparing a driver's position with the relevant directional performance evidence.
There is a similar trap in treating an angular distribution as a perfectly uniform cone. Performance at one horizontal and vertical coordinate does not prove identical output throughout every direction inside an imagined boundary. Request the specified distribution or test information for the relevant positions. The historical the original Illinois report study can inform the observation discussion, but its particular arrangement should not be converted into a universal acceptance angle.
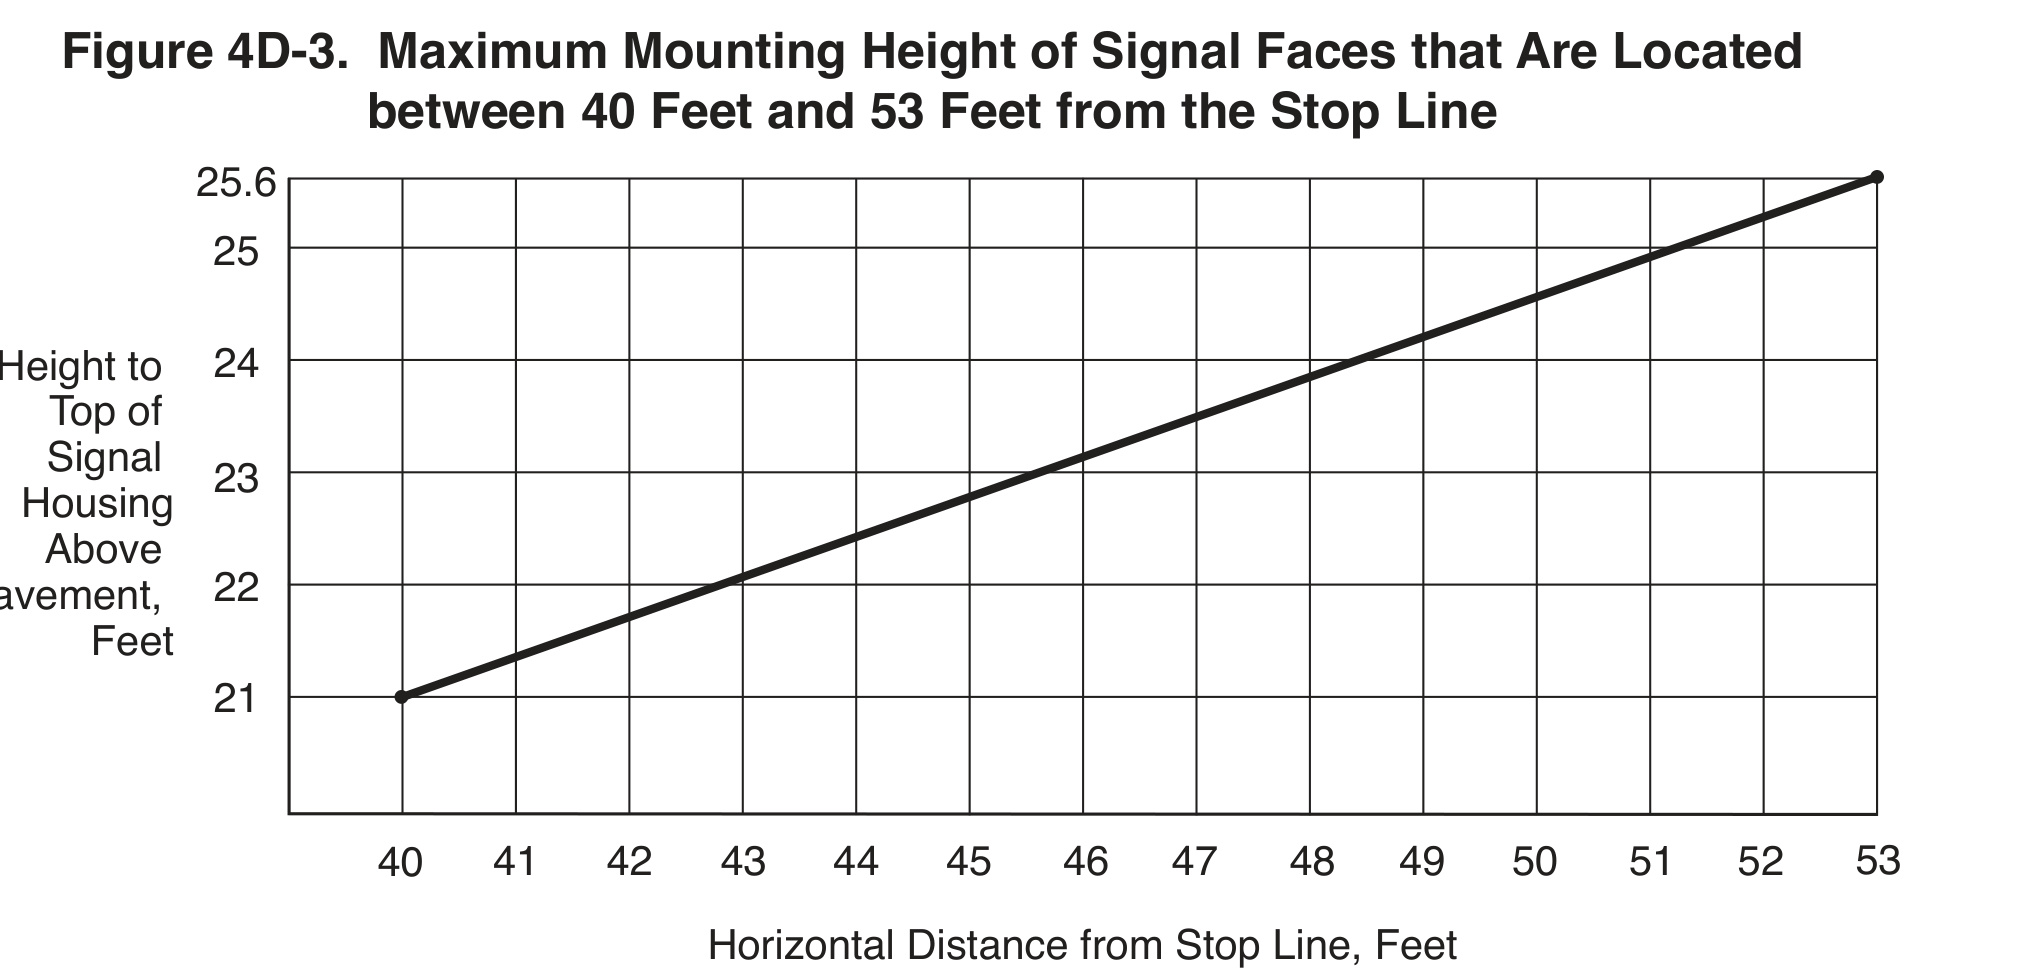
At a horizontal distance of about 45 feet from the stop line, this graph reads approximately 23 feet to the top of the signal housing above the pavement. The measurement is to the top, not the bottom clearance. The graph also has a defined 40-to-53-foot distance range; extending its line beyond that range would invent guidance the figure does not provide. Apply the complete Section 4D.09 provisions when reviewing the mounting arrangement.
Use a before-and-after record that can support a conclusion
If a change is proposed, identify the observation that would demonstrate its effect. For an obstruction problem, show the same approach position before and after. For an aiming question, retain the documented setting and observation geometry. For a background treatment, compare conditions that make the background relevant. Changing the location, camera exposure and weather simultaneously makes it harder to attribute the improvement to the intervention.
Photographs remain supporting records. Automatic exposure can make two scenes look deceptively similar, while a zoomed image can make a distant indication look larger than it appeared to the observer. Keep the original view and its context, then add a detail image if needed. A useful review explains where the driver is, what changed and why that change addresses the identified visibility issue. It should leave the next engineer with a reproducible question rather than an attractive but unmeasured impression.
Frequently asked questions
Is the widest possible viewing angle always best?
Do not decide from a width claim alone. The installation needs the intended approaches to see the correct indication under the design requirements.
Can the Illinois offset be used as a standard requirement?
No. It is a historical study condition and must retain that context. (Illinois DOT / ICT-09-043 (2009))
Does a module drawing establish driver visibility?
It establishes geometry of the part. The optical record and installed approach geometry answer different questions.
Sources
- LEOTEK IL6-P3 10-28 Vdc specification. Revision July 1, 2019; drawing page 1, model table page 2
- LEOTEK SPC 80-135 Vac specification. Revision November 13, 2018; drawing page 1, model and standard entries page 2
- Illinois DOT / ICT-09-043 (2009). Evaluation of LED Vehicular and Pedestrian Modules, April 2009; historical model table and methods; Tables 5-7 and 5-10
Additional research and calculation basis
- FHWA, MUTCD 11th Edition with Revision 1 (December 2025)
- Illinois DOT / ICT-09-043 (2009); methods and Tables 5-7, 5-10
Cover image: AI-generated editorial illustration for LEOTEK. The generic scene is not a verified installation, product photograph or test record. Technical figures and tables carry their own source credits.