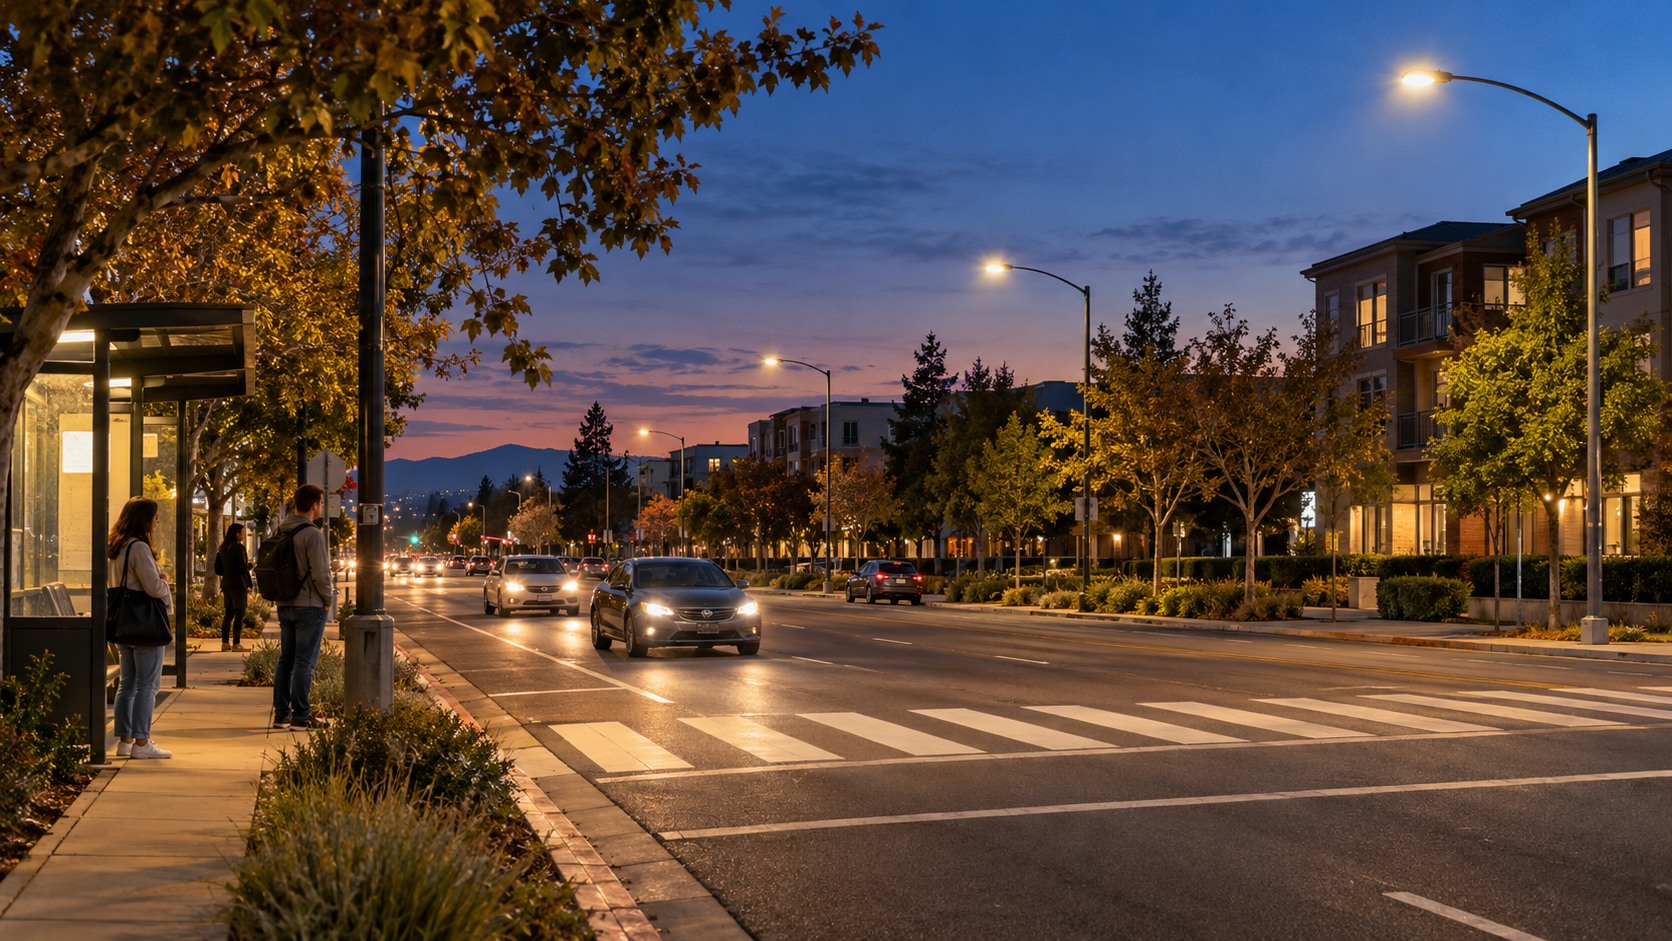






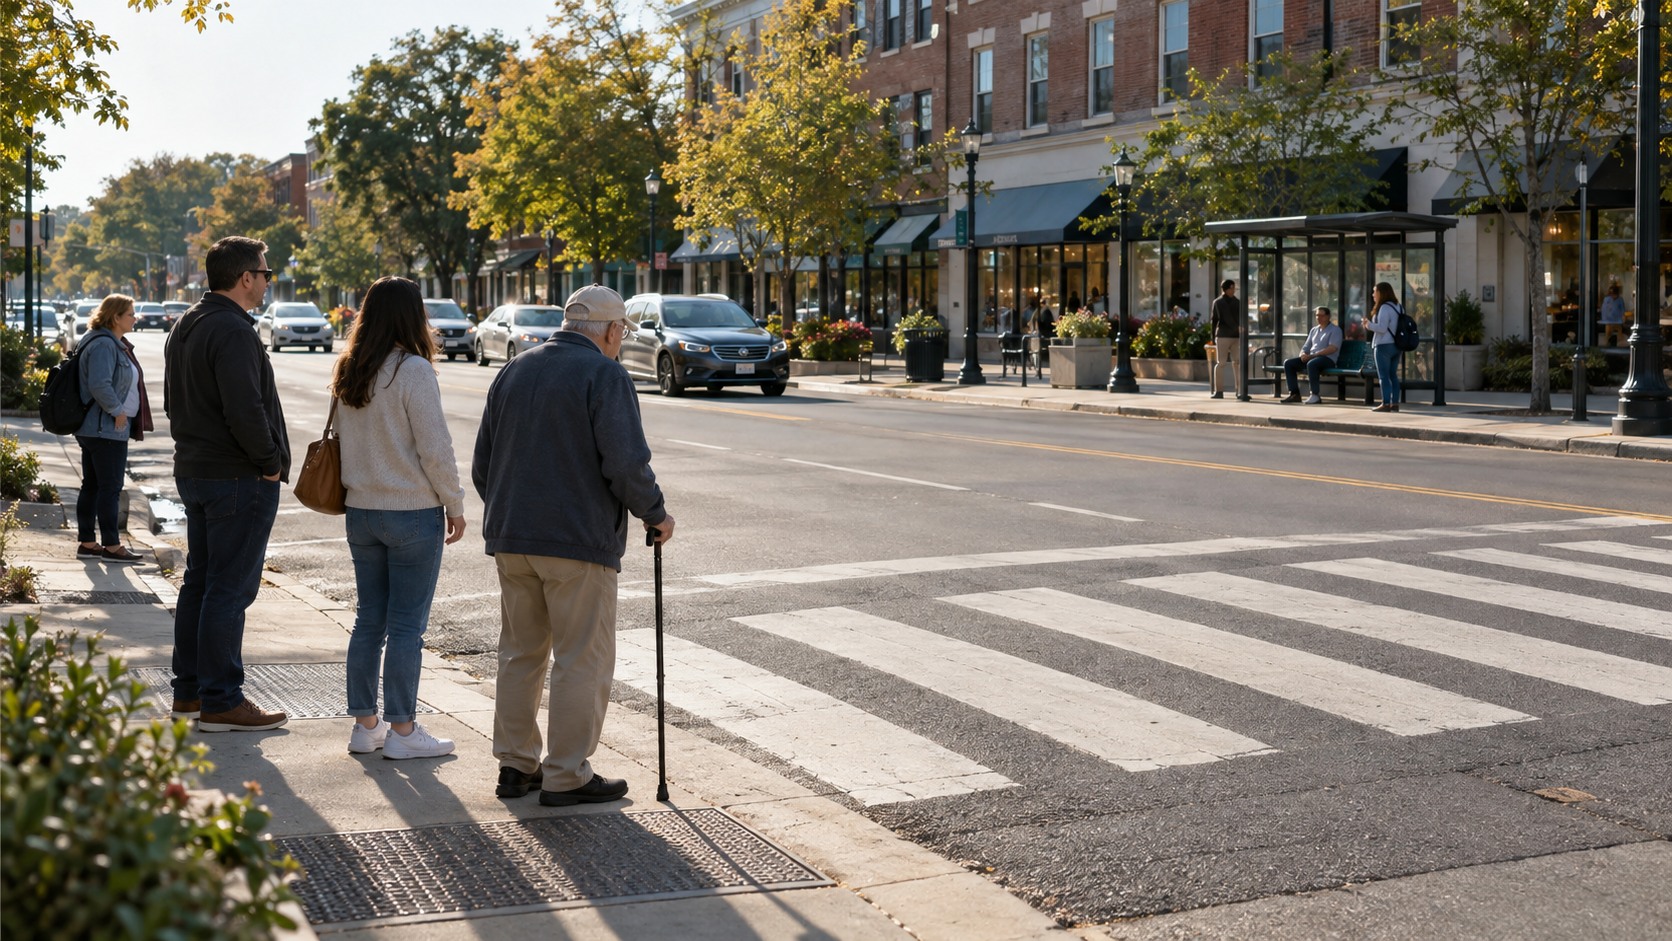
The most revealing observation at a difficult crossing can be the person who never attempts it. A bus stop, senior housing entrance or school route may sit across a busy road, yet a short count records few crossings. That number describes observed use. It may not describe everyone who needs to cross.
MUTCD Warrant 4 evaluates pedestrian demand together with major-street traffic. It is intended for locations where heavy traffic causes excessive pedestrian delay. This guide explains the four pedestrian-volume figures, the walking-speed adjustment and the field observations that keep a chart result connected to the people using the street.
Define the crossing before counting it
Begin with a diagram showing where pedestrians cross the major street, where they wait, how far they travel and what blocks their view. Identify transit stops, destinations, accessible routes, driveways and nearby controlled crossings. Record people crossing outside the preferred path as well as those using the marked crosswalk; the observed route can expose a mismatch between the design and the destination.
Section 4C.05 uses the total pedestrians crossing the major street and the corresponding major-street vehicle volume from both approaches. A four-hour test and a peak-hour test are available. Neither can be evaluated from a daily pedestrian total divided by an assumed number of active hours.
Use aligned time periods, ideally retaining the underlying 15-minute counts. If a major-street surge and pedestrian surge occur at different times, preserve that fact. Combining their separate maxima would describe a crossing condition the field team did not observe.
What the four-hour figure actually asks
For each of any four hours of an average day, the paired point must fall above the applicable curve in Figure 4C-5. The four hours need not be consecutive. Their pedestrian counts cannot be averaged into a single point and treated as four successful hourly evaluations.
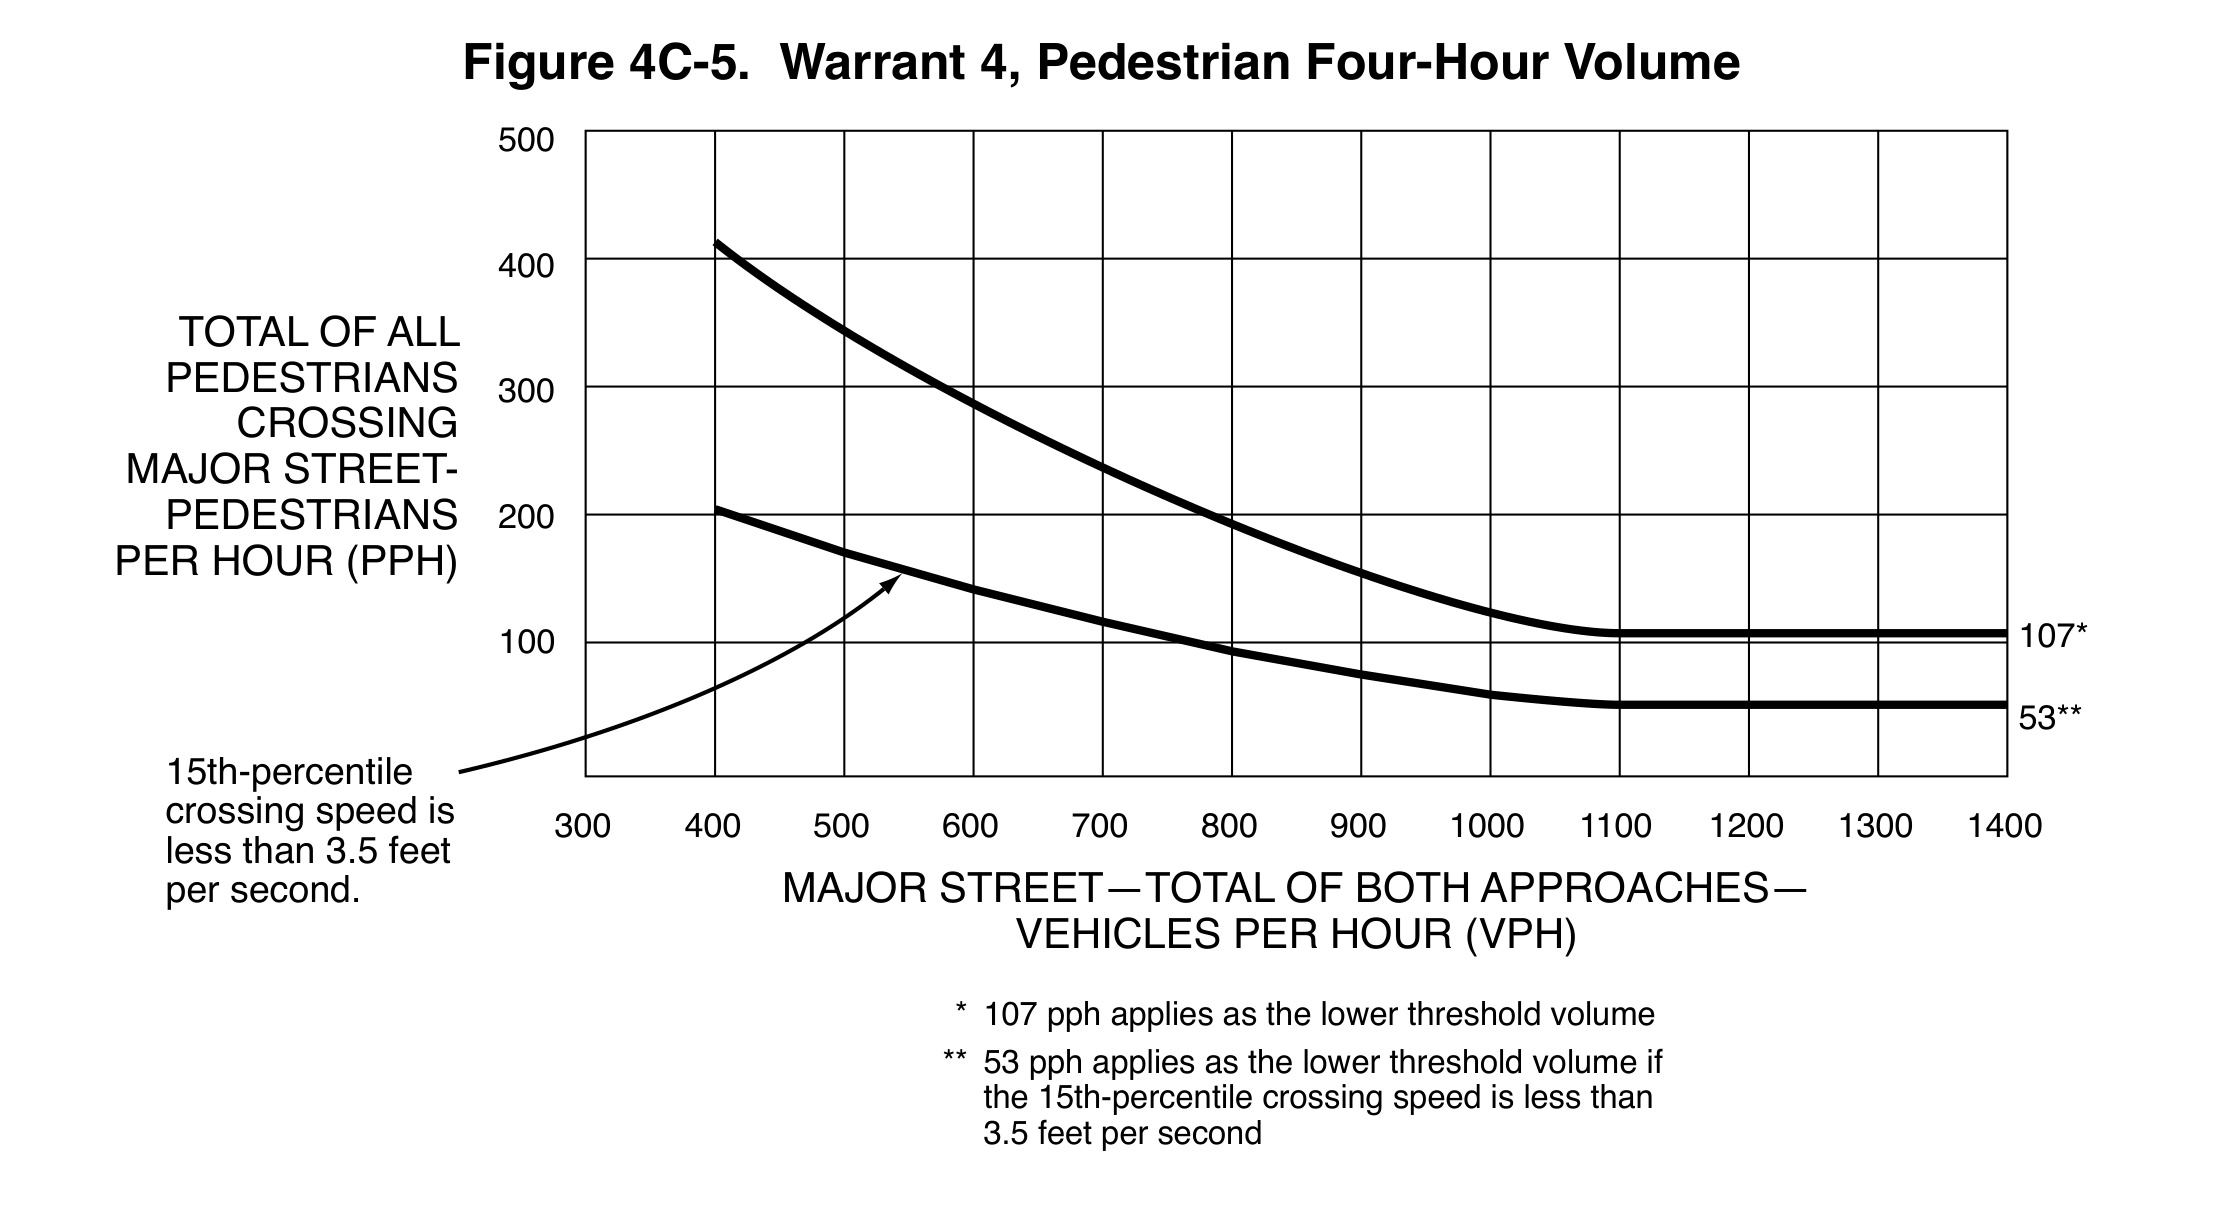
Read horizontally from the corresponding major-street vehicle volume, then compare the pedestrian count with the curve. The figure’s lower threshold is a floor, not a standalone “install a signal at this many pedestrians” rule. At a different vehicle volume, the sloping part of the curve can call for a higher pedestrian volume.
The lower curve identifies the walking-speed adjustment described in Section 4C.05. Preserve the footnotes when sharing the figure. A cropped screenshot showing only the flatter portion can make the chart appear to establish a universal pedestrian minimum, which is exactly the misunderstanding a review should prevent.
The peak-hour pedestrian test is a separate option
Figure 4C-6 evaluates one hour, formed from four consecutive 15-minute periods of an average day. This is Warrant 4’s pedestrian peak-hour criterion. It should not be confused with Warrant 3, which concerns unusual vehicular peak-hour conditions and uses different figures and criteria.
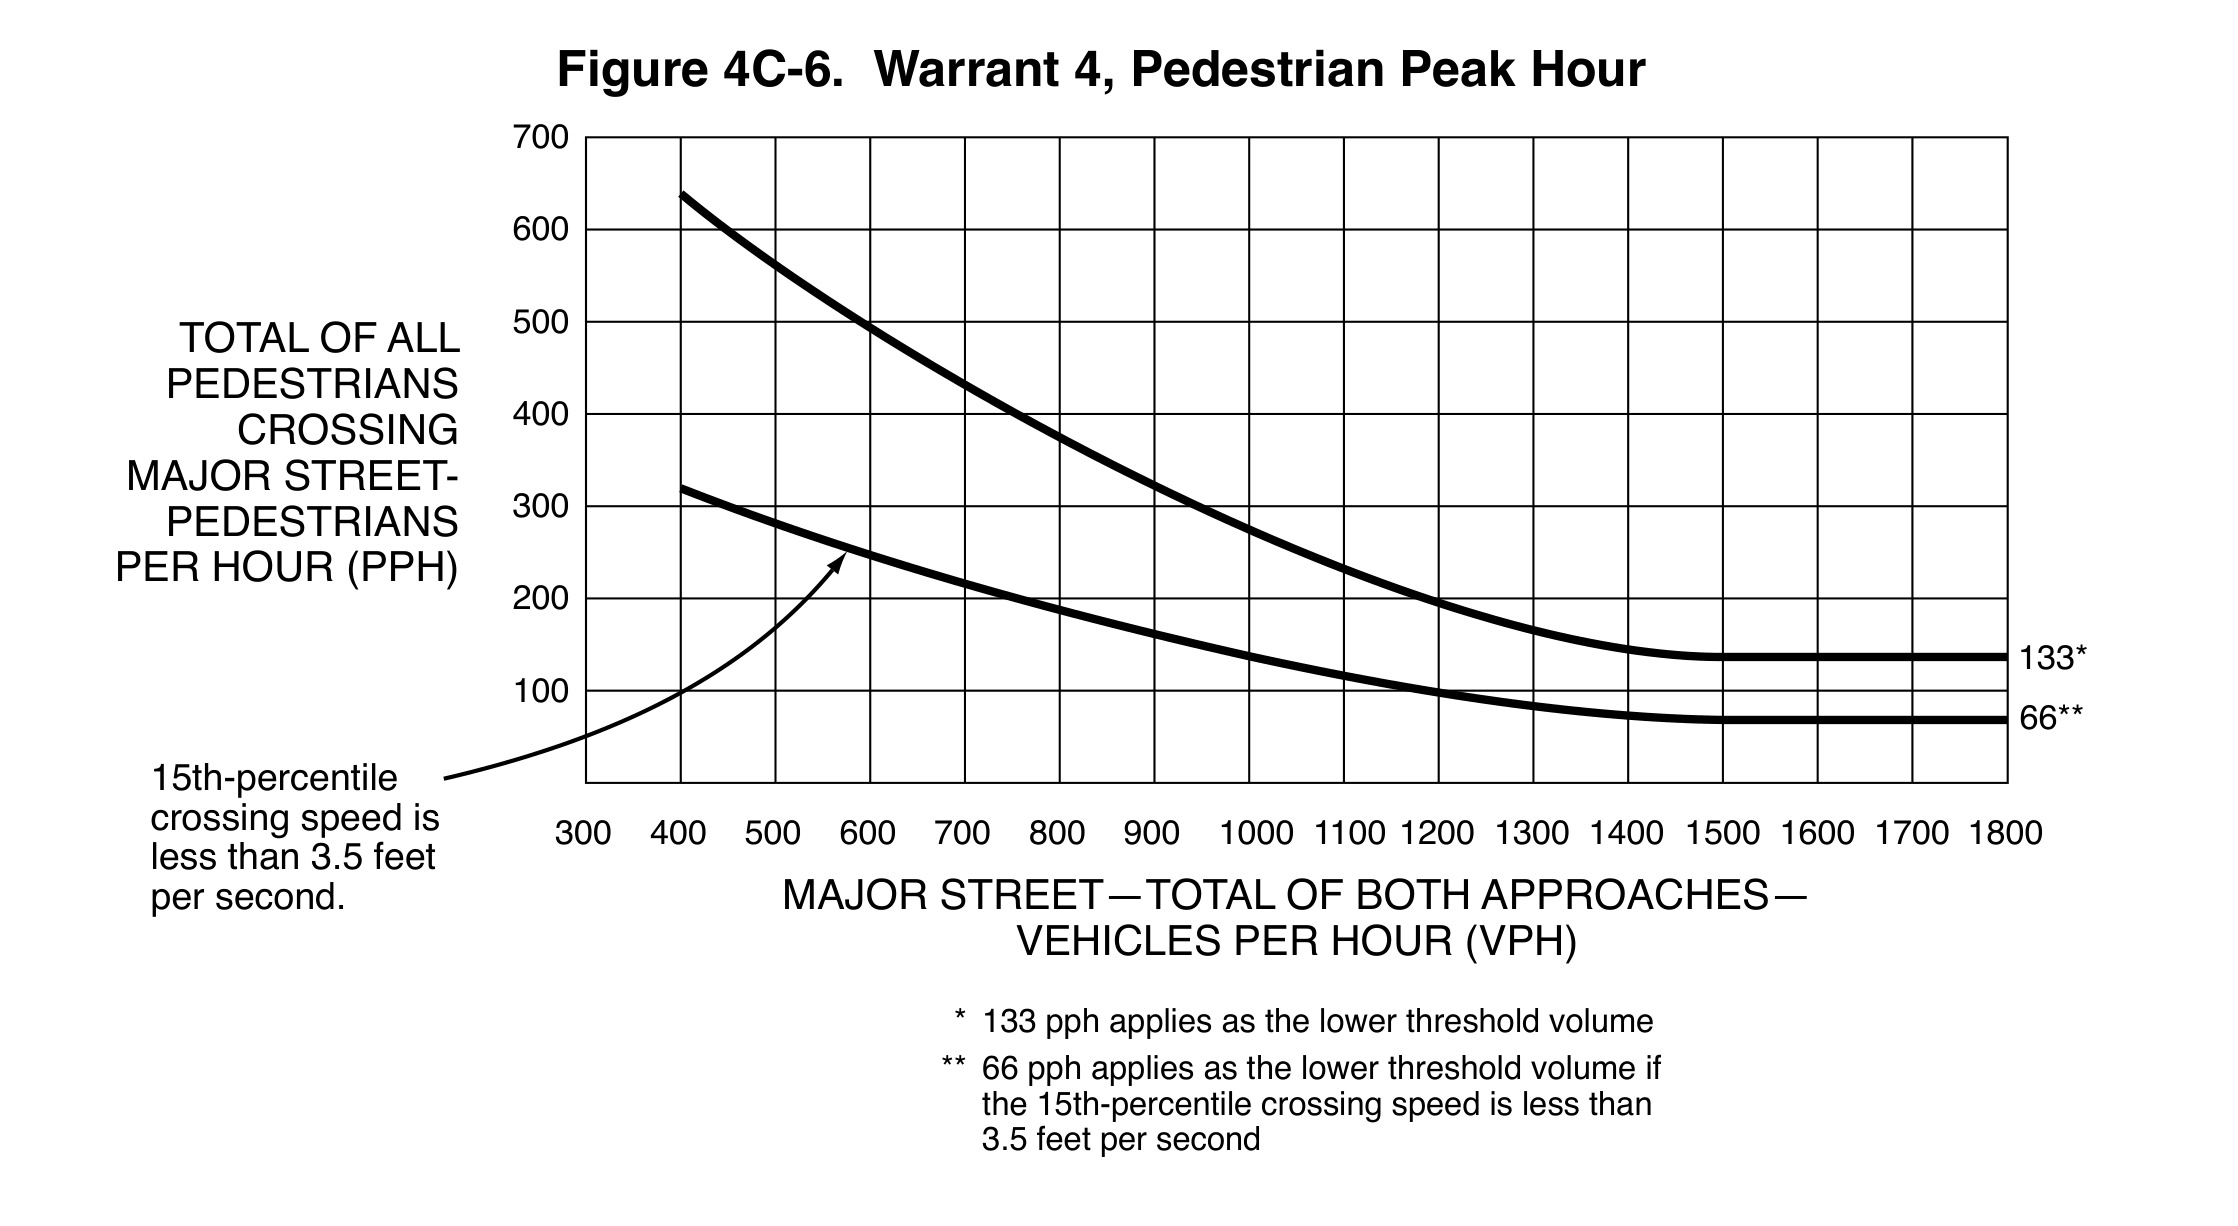
The ordinary peak-hour pedestrian figure has a 133-pedestrian-per-hour lower threshold, compared with 107 in the ordinary four-hour figure. Those are the unadjusted floors shown in the notes. Neither floor alone establishes the result, because the corresponding major-street traffic volume and the selected curve still matter.
For a school dismissal concentrated in a brief period, retain the complete observation window rather than assuming the busiest 15 minutes continues for an hour. Section 4C.06 also provides a separate School Crossing warrant involving schoolchildren and the adequacy of gaps. A pedestrian-volume worksheet should not silently substitute for that different investigation.
Why the pedestrian speed condition is 35 mph
Under Section 4C.05, Figures 4C-7 and 4C-8 may replace the ordinary figures when the major street’s posted or statutory speed limit, or its 85th-percentile speed, exceeds 35 mph. The alternative also applies within the built-up area of an isolated community with fewer than 10,000 people.
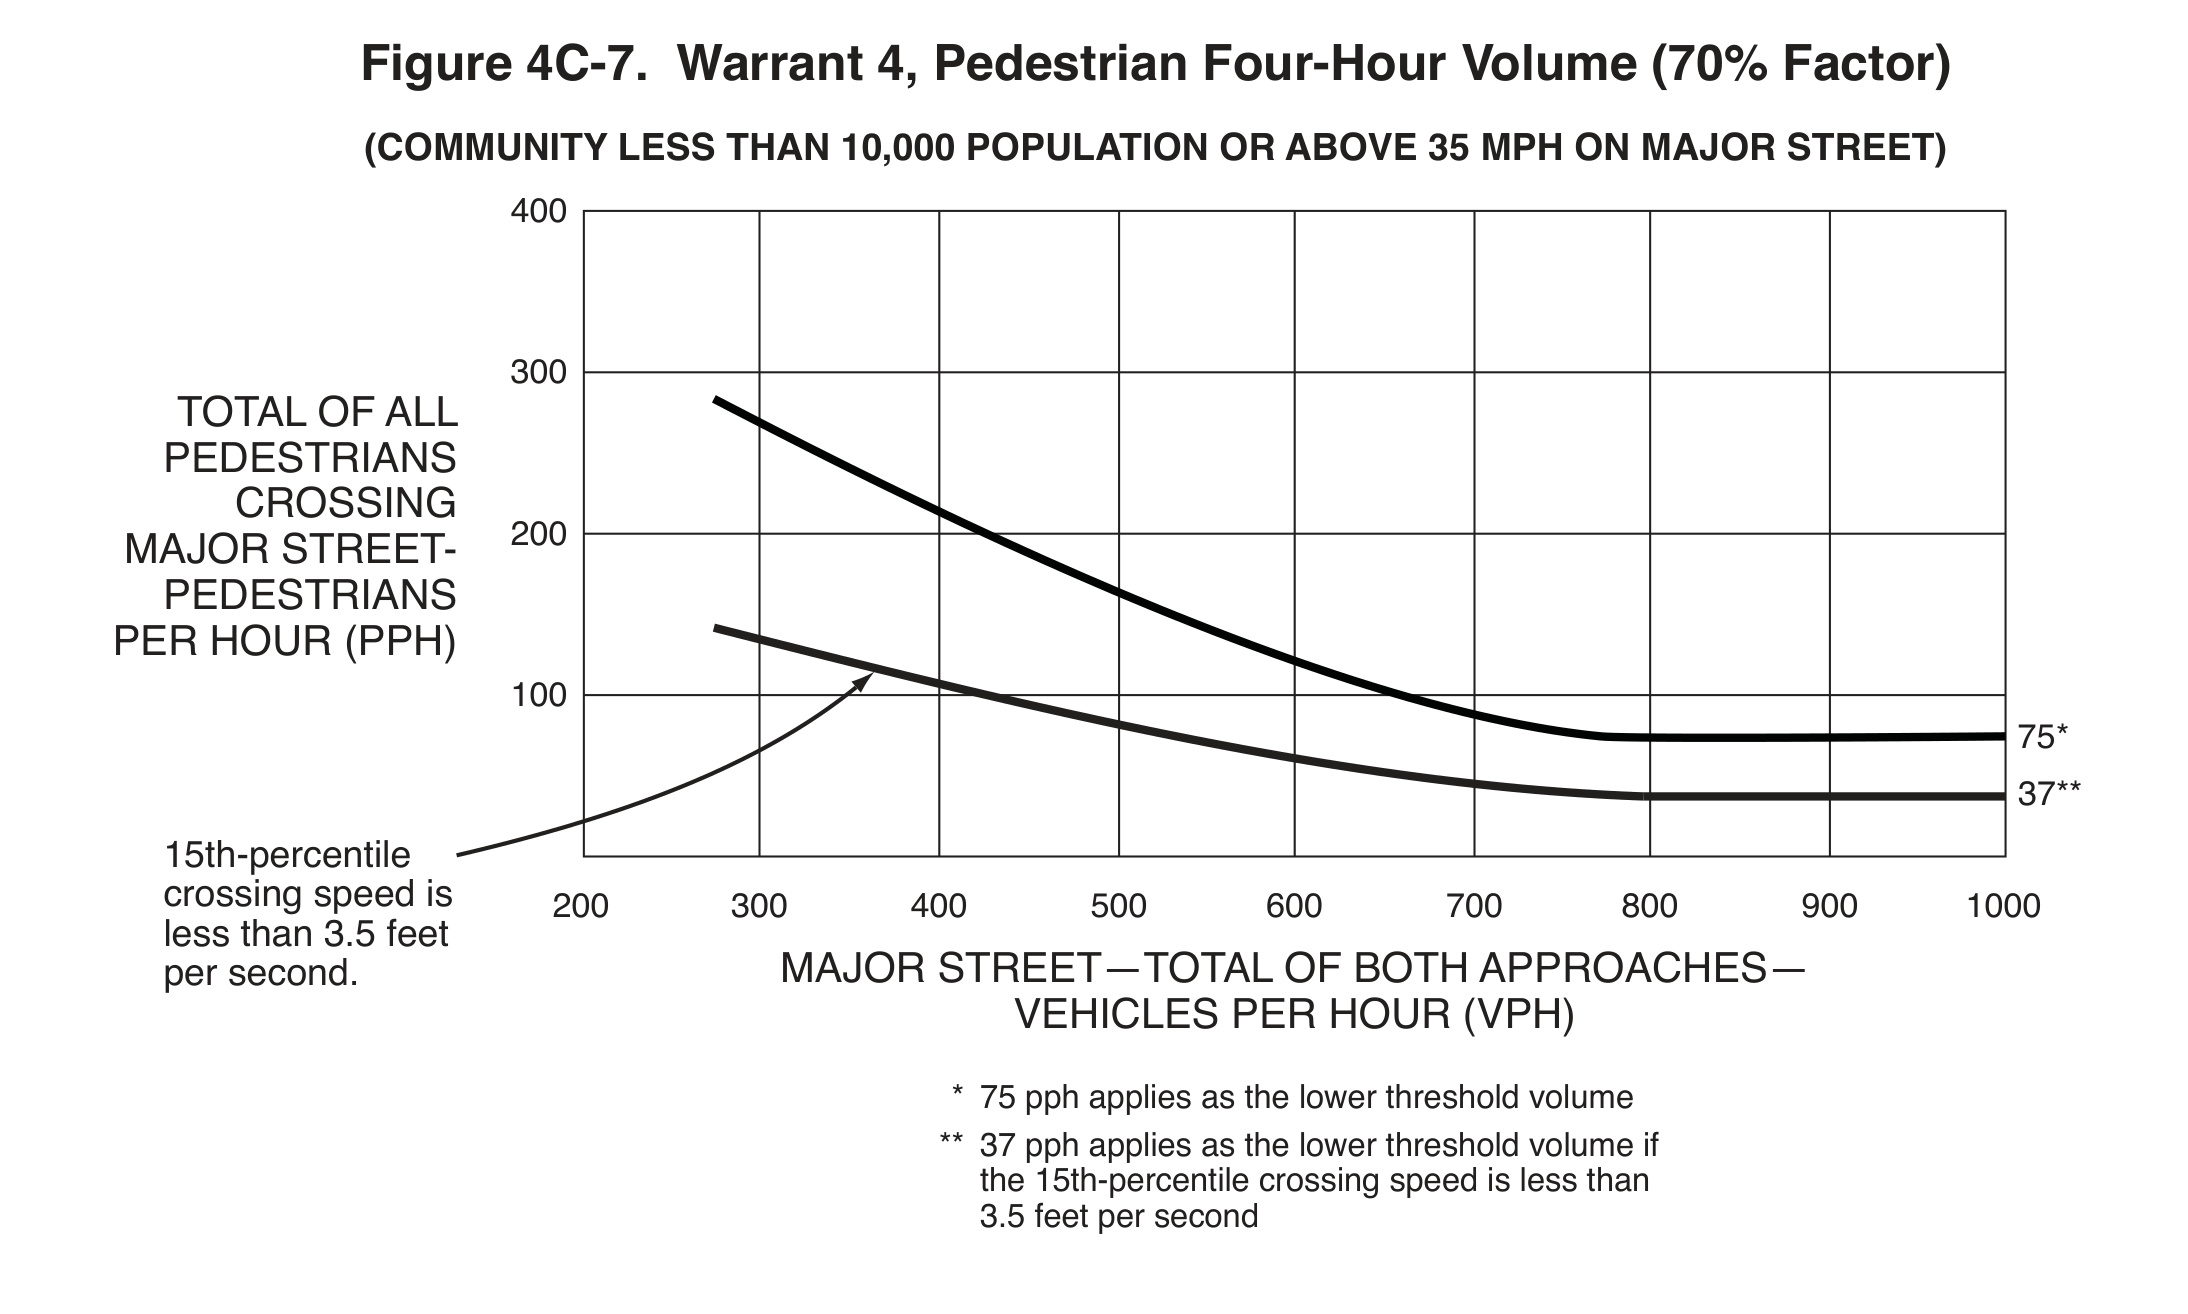
This is a consequential difference from the vehicle-volume warrants’ 40 mph provision. At a qualifying 40 mph major street, the pedestrian alternative can be available through that speed measure, while the corresponding vehicle-volume alternative requires a measure exceeding 40 mph. Record the section and speed basis instead of labeling a spreadsheet simply “high speed.”
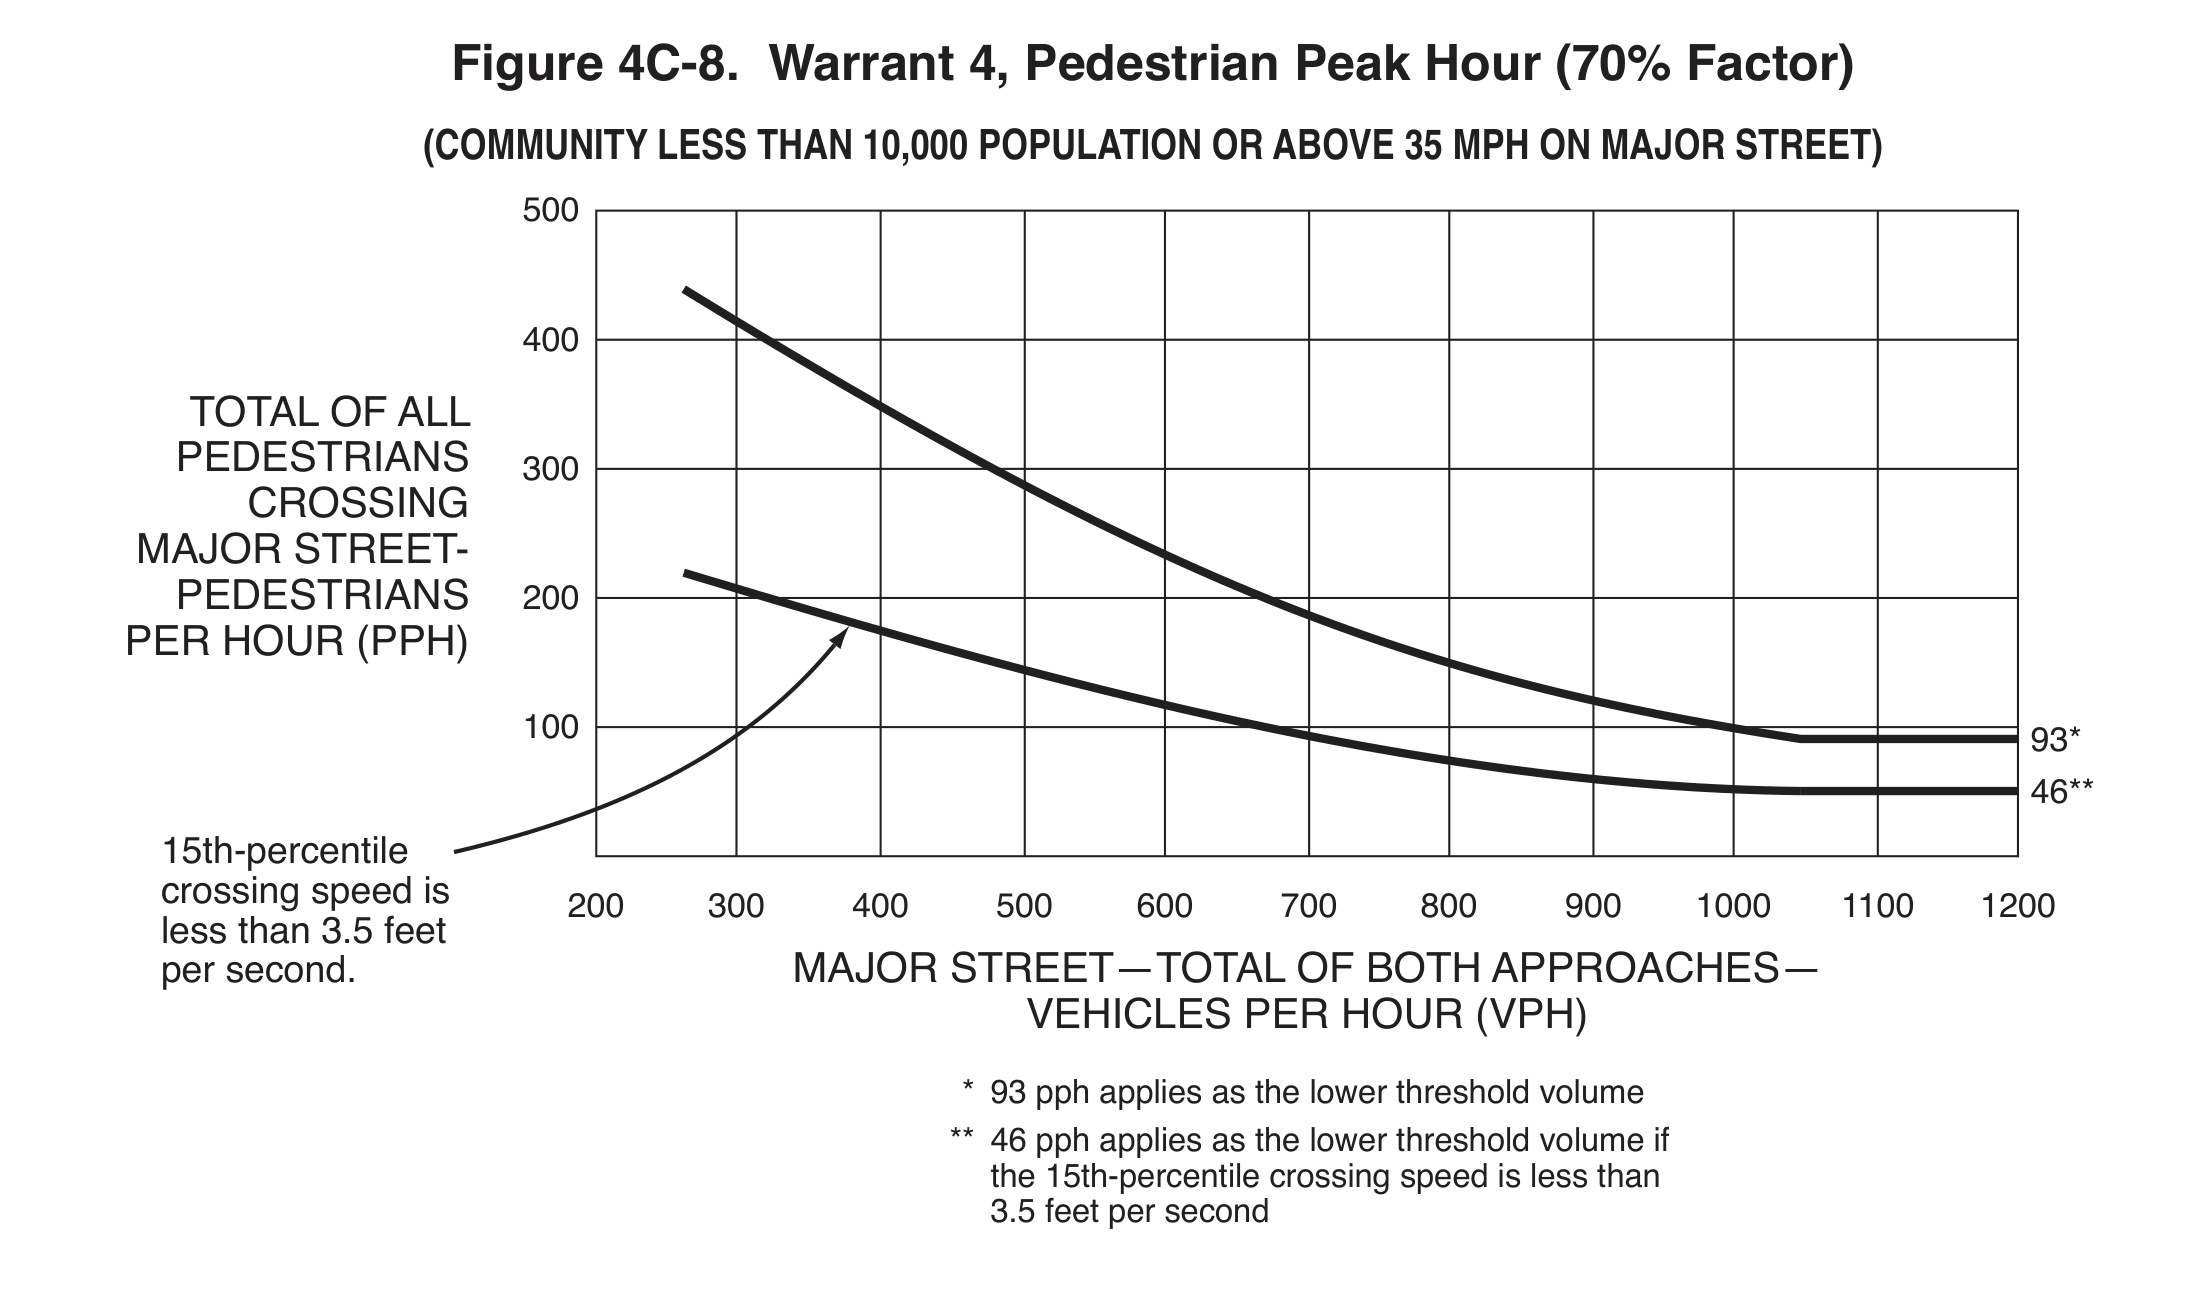
Use Figure 4C-7 for the four-hour procedure and Figure 4C-8 for the one-hour procedure. Their unadjusted floors are 75 and 93 pedestrians per hour respectively. Read the complete curves and notes; the “70% factor” is already represented in these figures and is not an instruction to reduce them again.
The walking-speed adjustment is about the slower end of the group
Section 4C.05 permits the pedestrian-volume criterion to be reduced by as much as 50 percent when the 15th-percentile crossing speed is below 3.5 feet per second. This is a percentile measure, not the average speed. A group can have a seemingly comfortable average while a meaningful share of users needs more time.
For a hypothetical field exercise, an 84-foot crossing completed in 30 seconds corresponds to 2.8 feet per second. One observation at that speed does not establish the 15th percentile. A study needs an appropriate sample and a stated method, including where timing starts and ends and whether a waiting period was mistakenly included.
The reduced walking-speed curves are already shown in Figures 4C-5 through 4C-8. If that curve is selected, do not halve its threshold again. Document the observed percentile, the adjustment selected and the resulting curve. This makes the accessibility-related reasoning visible instead of leaving a mysterious factor in a spreadsheet cell.
This warrant adjustment also does not calculate a signal’s pedestrian clearance interval. Warrant evaluation asks whether a type of control deserves consideration; timing asks how an installed crossing serves people. The latter requires the separate provisions of Chapter 4I, including the relevant walking-distance and timing conditions.
A median changes the analysis only if people can wait there
Where a divided street has a median of sufficient width for pedestrians to wait, Section 4C.05 allows the criteria to be applied separately to each direction of vehicle traffic. The practical question is whether the median provides a usable waiting place in the actual crossing path. A stripe or a narrow raised separator should not be assumed to establish that condition.
Document dimensions, access, alignment and the intended crossing operation. A two-stage concept changes the distance and exposure considered in the analysis, but it also introduces a place where users may wait. Field photos should show that waiting area rather than merely the median’s widest point somewhere else along the road.
Study gaps and delay, not just how many people crossed
A useful observation log records arrival time at the curb, usable gaps, attempted crossings, abandoned attempts and interactions with turning vehicles. These are field-study suggestions, not additional numeric warrant thresholds. They explain what the count alone cannot: whether pedestrians wait because gaps are scarce, visibility is poor or drivers do not respond as expected.
Section 4C.01 specifically recognizes that nearby facilities serving younger people, older people or people with disabilities may generate requests for accommodation, and that missing signal control may restrain their mobility. Talk with the agency and relevant facility representatives when planning the study. Do not turn low observed use into evidence that the connection has no value.
Timing observations also help distinguish an all-day problem from a short but repeated conflict. A bus arrival can release a group at the same moment as a platoon of vehicles. An hourly total retains the right units for the warrant, while the interval record explains why the experience at the curb feels worse than the average suggests.
Check nearby signals before recommending another one
Section 4C.05 advises against applying this warrant within 300 feet of the nearest traffic signal or STOP sign controlling the street pedestrians want to cross, unless the proposed signal will not restrict traffic progression. It also notes that adjacent coordinated signals can provide adequate gaps. Both provisions call for an operational review, not a distance measurement alone.
If a signal is justified under the warrant and installed, Chapter 4I pedestrian signal heads are required. Other guidance addresses detection, coordination, location and sight obstructions. Meeting the demand criterion is therefore the beginning of design, rather than a complete specification for a countdown display or pushbutton.
Where full signal control is not selected, the crossing still needs an appropriate response. A PHB has its own Chapter 4J application guidance; an RRFB is supplemental warning at an uncontrolled marked crossing under Chapter 4L. Consider visibility, crossing distance, refuge, lighting and accessibility alongside the control choice. A device label alone cannot resolve a difficult approach geometry.
What a review-ready crossing brief contains
Keep the raw aligned counts, evaluated hours, speed basis, crossing diagram, walking-speed observations, gap and delay notes, nearby-control review and alternatives considered in one record. Identify which observations are measured, which are reported by users and which are assumptions. That separation makes a disagreement productive: reviewers can identify the missing evidence instead of debating a conclusion without its basis.
For procurement, carry the accepted operation into the equipment requirements. Indication layout, electrical input, detector placement, accessible information and controller behavior belong in the project submittal. A warranted crossing does not establish that every pedestrian module with the same face size will work in the existing cabinet.
Frequently asked questions
Is 107 pedestrians per hour enough to require a signal?
Not by itself. It is a lower threshold in the ordinary four-hour figure. The paired vehicle volume, curve, four evaluated hours and engineering-study conclusion all matter. Meeting a warrant does not automatically require installation.
Can I use average walking speed for the 50-percent adjustment?
The stated condition is a 15th-percentile crossing speed below 3.5 feet per second. An average or one slow crossing is not the same measure. Keep the sample and calculation with the study.
Does low pedestrian volume mean no crossing improvement is justified?
No. Observed demand can be constrained by the crossing itself. Review users, destinations, delays, available gaps and other applicable control options. The manual’s warrant provisions do not replace an engineering assessment of the identified need.
Does the volume figure determine countdown timing?
No. Use Chapter 4I for pedestrian operation and timing. The demand figure supports a control decision; it does not specify how many seconds a particular person needs to cross.
Sources and related reading
- FHWA, MUTCD 11th Edition with Revision 1, Section 4C.05, printed pp. 656-660; Figures 4C-5 through 4C-8.
- Section 4C.01: engineering studies, pedestrian information and interpretation of warrants. Section 4C.06: separate School Crossing warrant.
- Chapter 4I: pedestrian control features and timing. Federal edition checked October 18, 2026; verify the responsible agency’s applicable requirements.
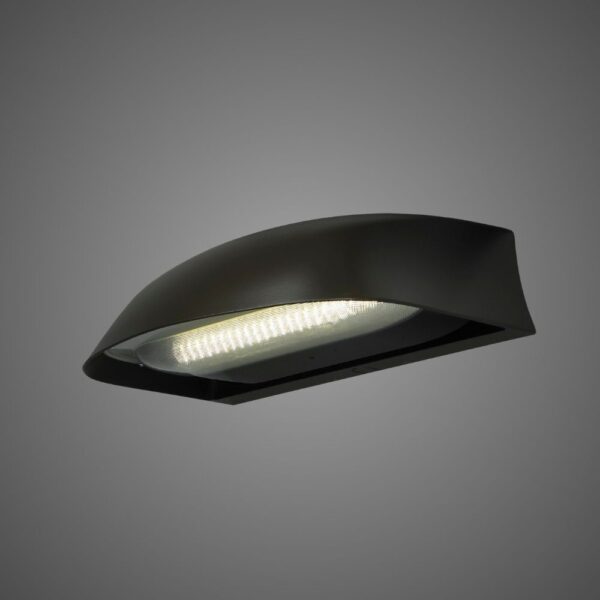
- LEOTEK SPC Series product information: check model-specific documents for the proposed equipment.
Continue the crossing-design review
- Traffic Signal Warrants: Read the Four-Hour and Peak-Hour Curves Correctly
- PHB or RRFB? Match the Crossing Treatment to the Control People Need
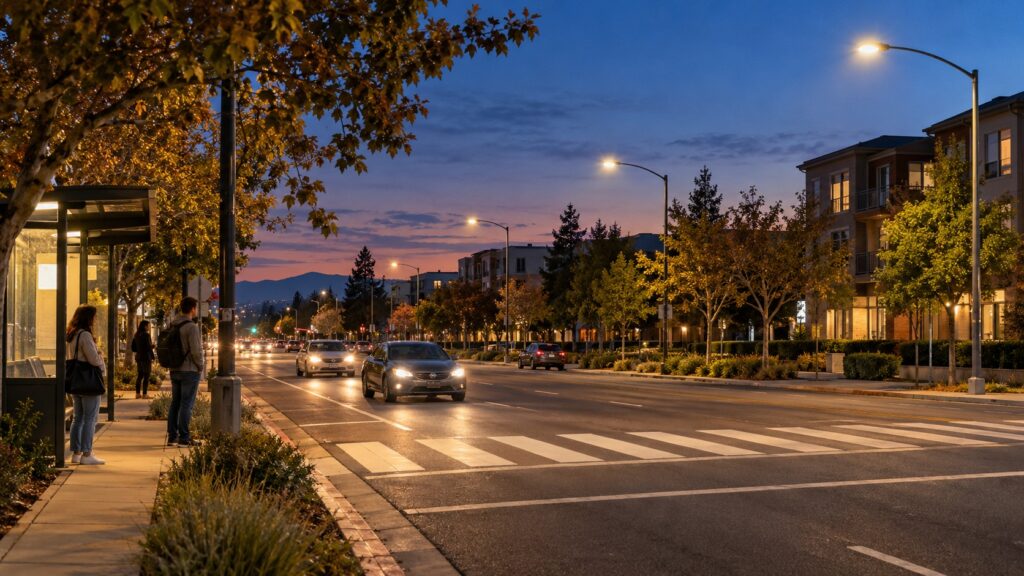
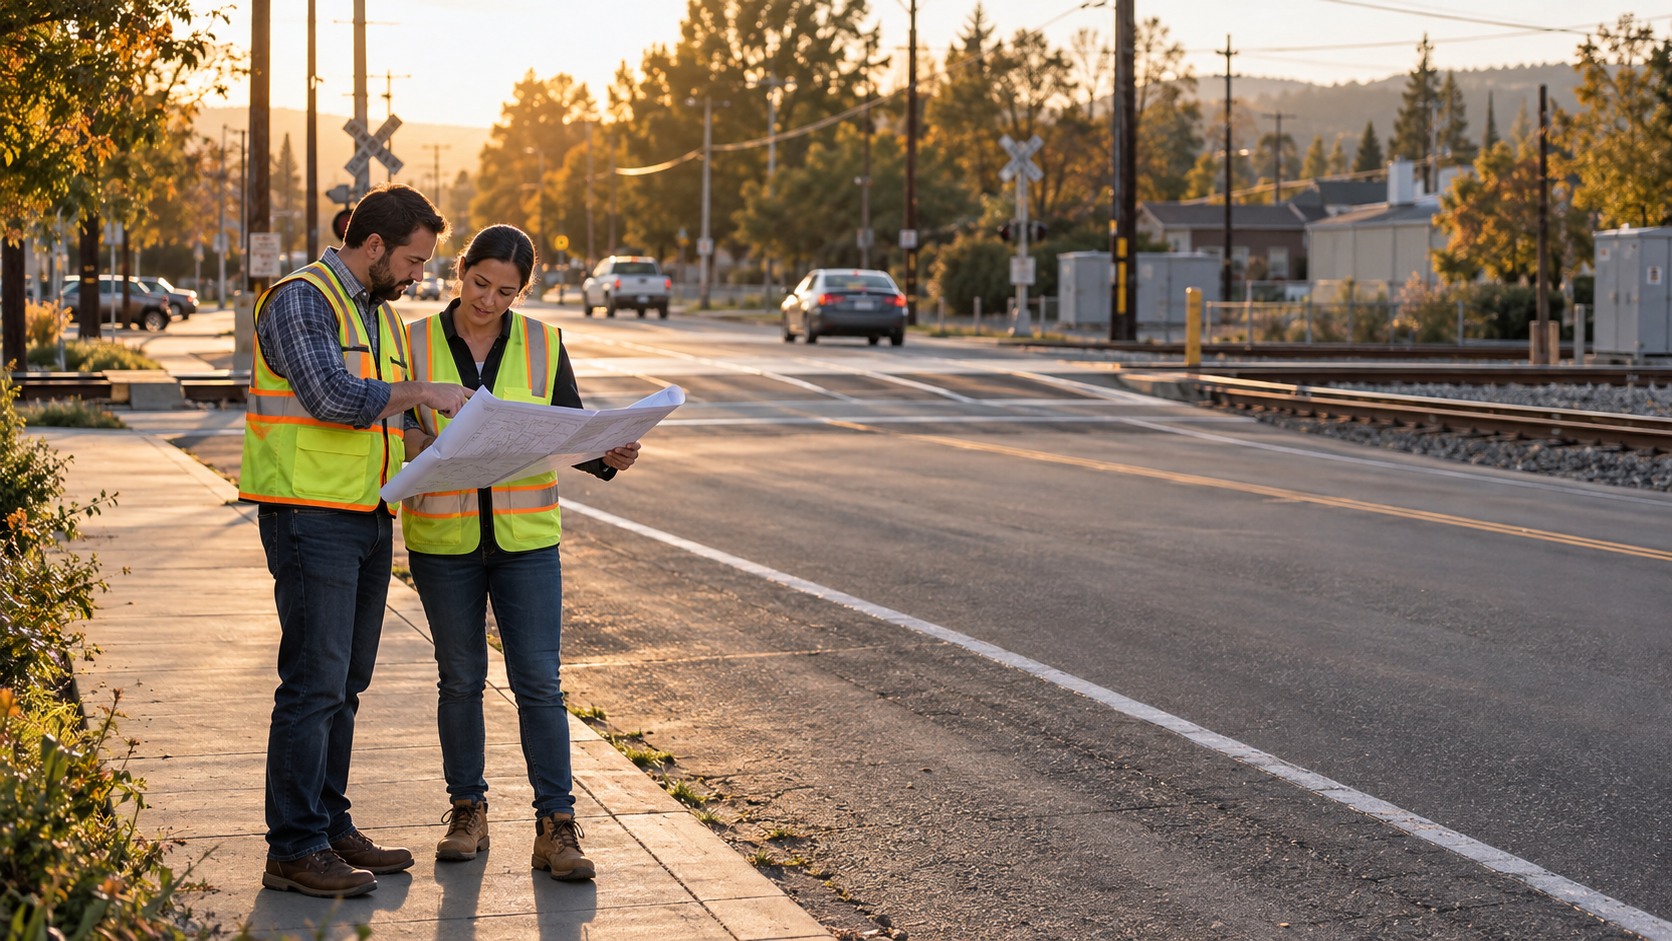
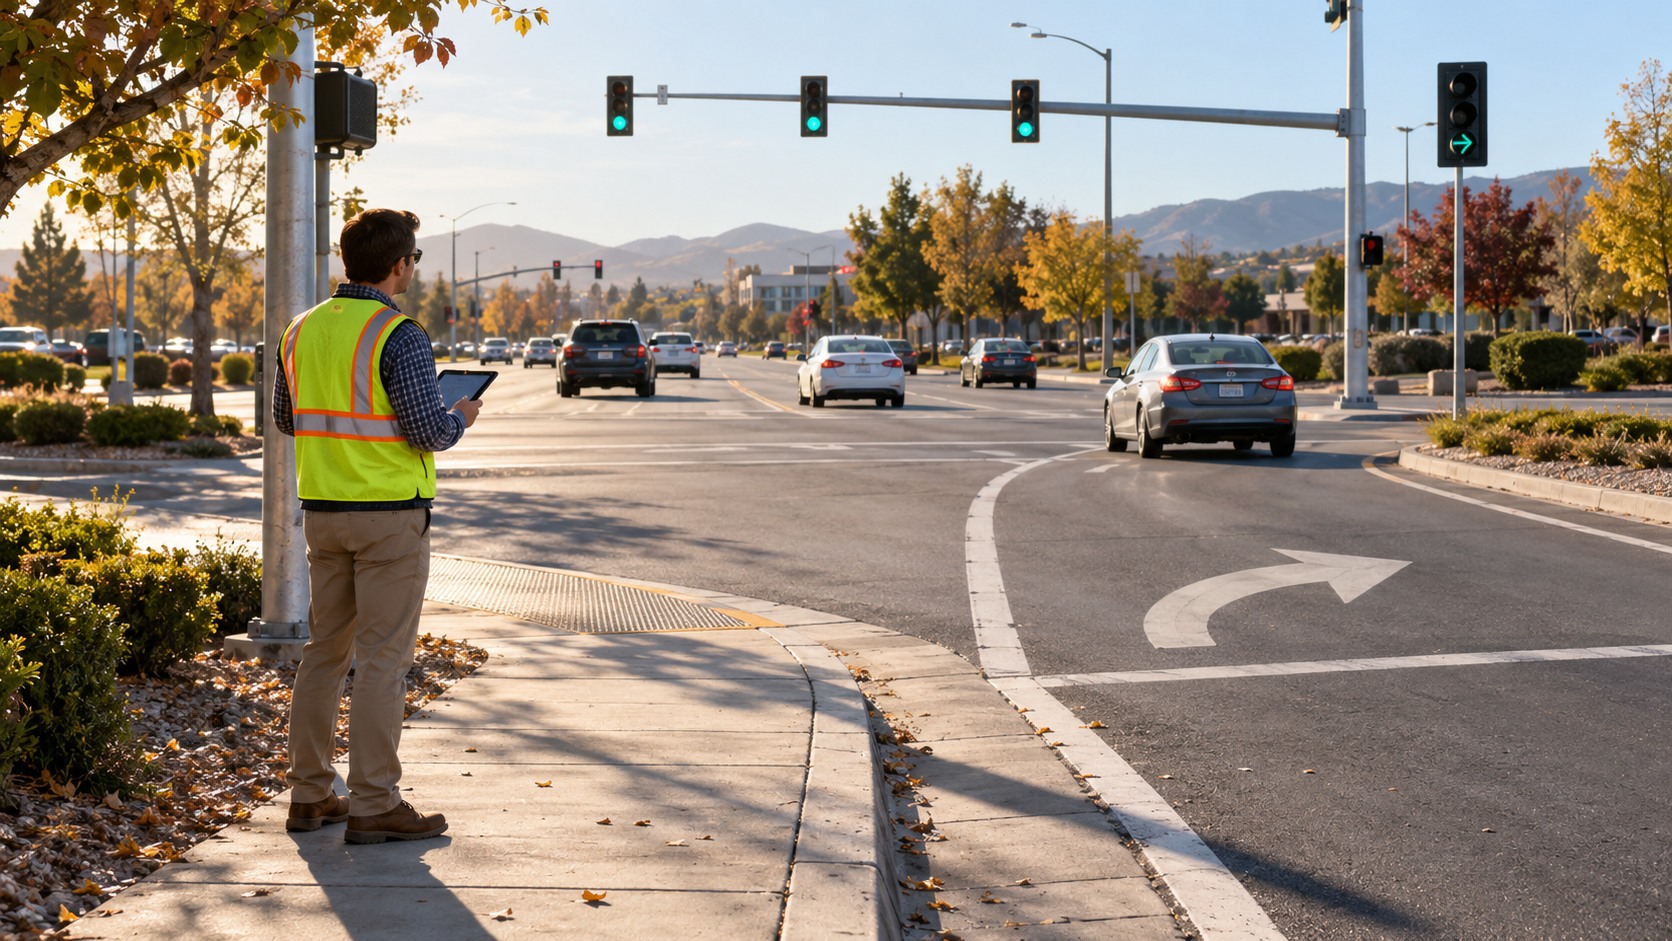
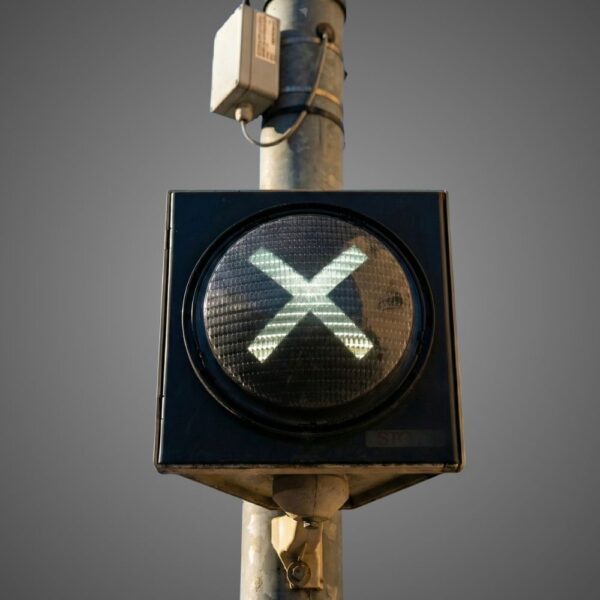
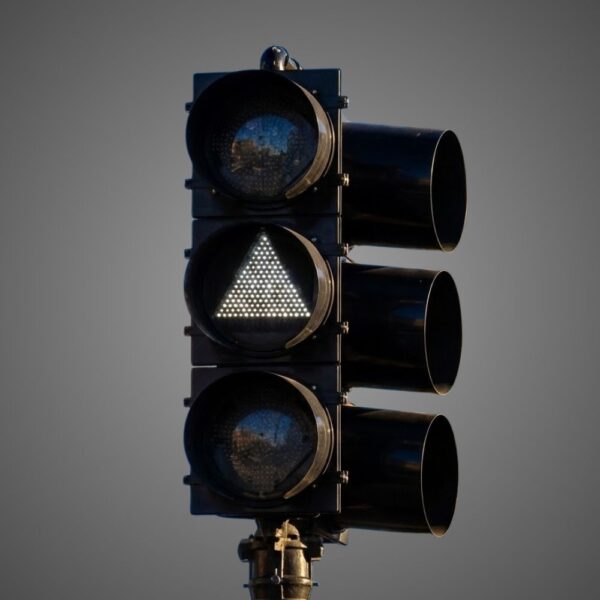
Cover: AI-generated editorial illustration for LEOTEK, not a verified installation or product photograph. Technical figures: FHWA/MUTCD originals, individually credited above.