



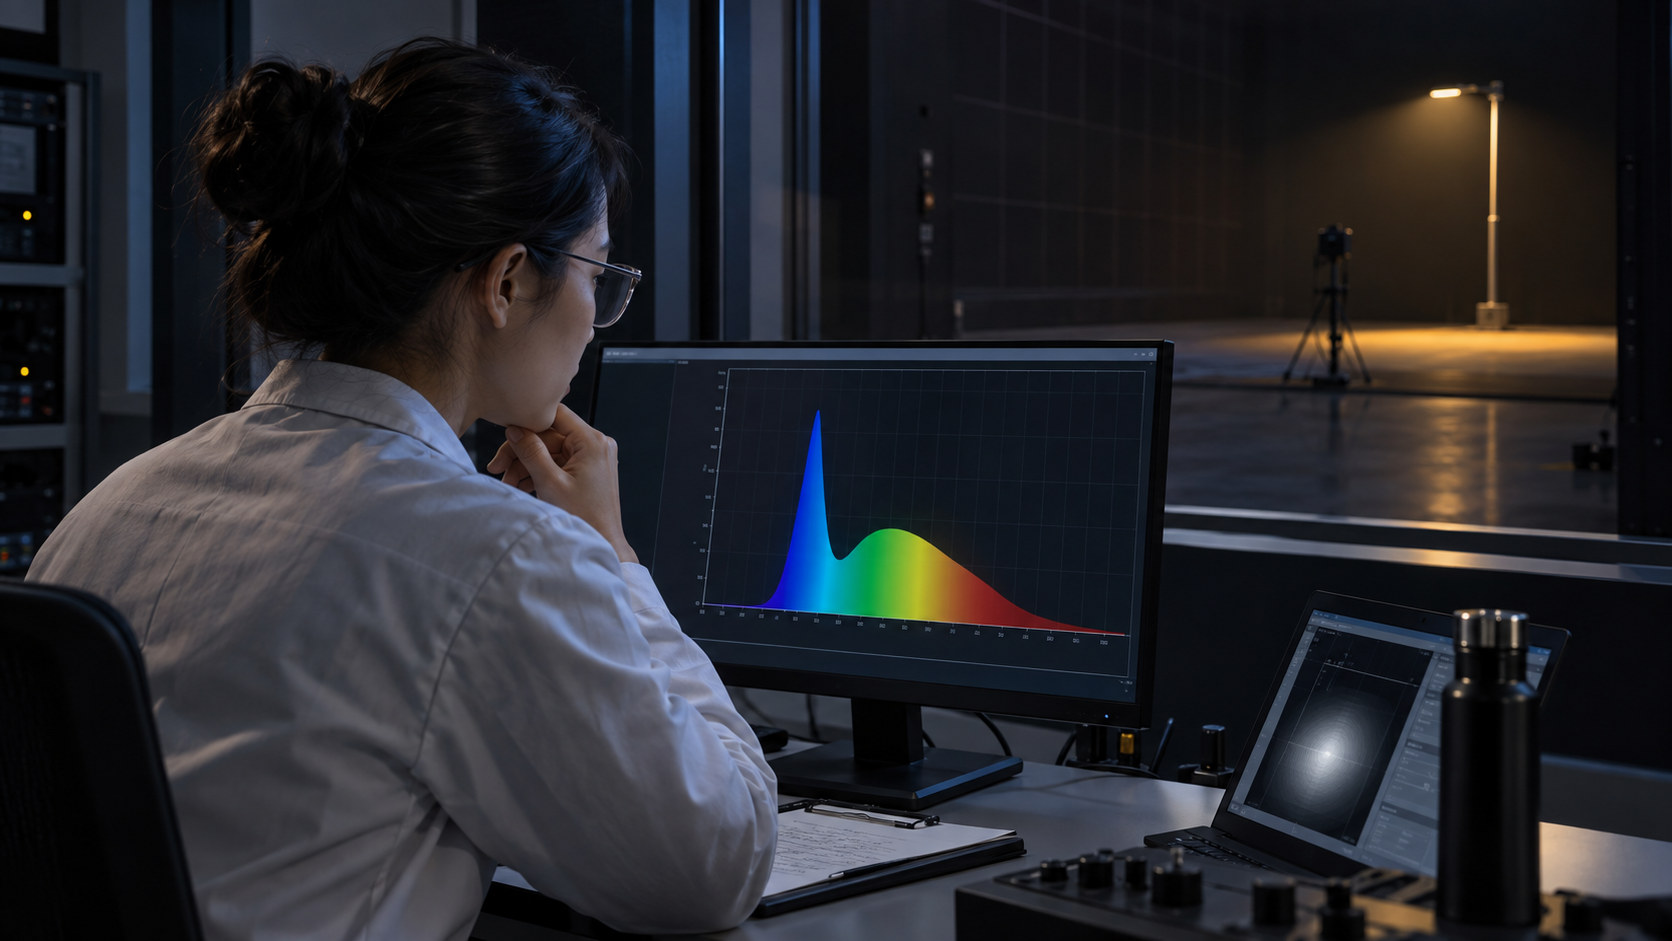
To compare blue-light content, start with the spectral power distribution (SPD) of the complete luminaire. Then state the wavelength band and calculation you are comparing. A 3000K label describes color appearance; it does not tell you how much radiant power falls in a particular band.
The useful question is therefore more specific than “How much blue light does it have?” Ask: blue light under which definition, measured in which configuration, and for what decision?
What an SPD tells you
An SPD shows optical output across wavelength. The horizontal axis is normally wavelength in nanometers; the vertical axis must identify its units or normalization. An absolute radiometric spectrum can support an output calculation. A normalized curve is useful for comparing shape, but its plotted height alone does not establish total emitted power.
Request the report for the finished luminaire, including the optic, lens or filter and the operating state being proposed. Those details matter when comparing a bare LED with an assembled product or one dimming/channel setting with another.
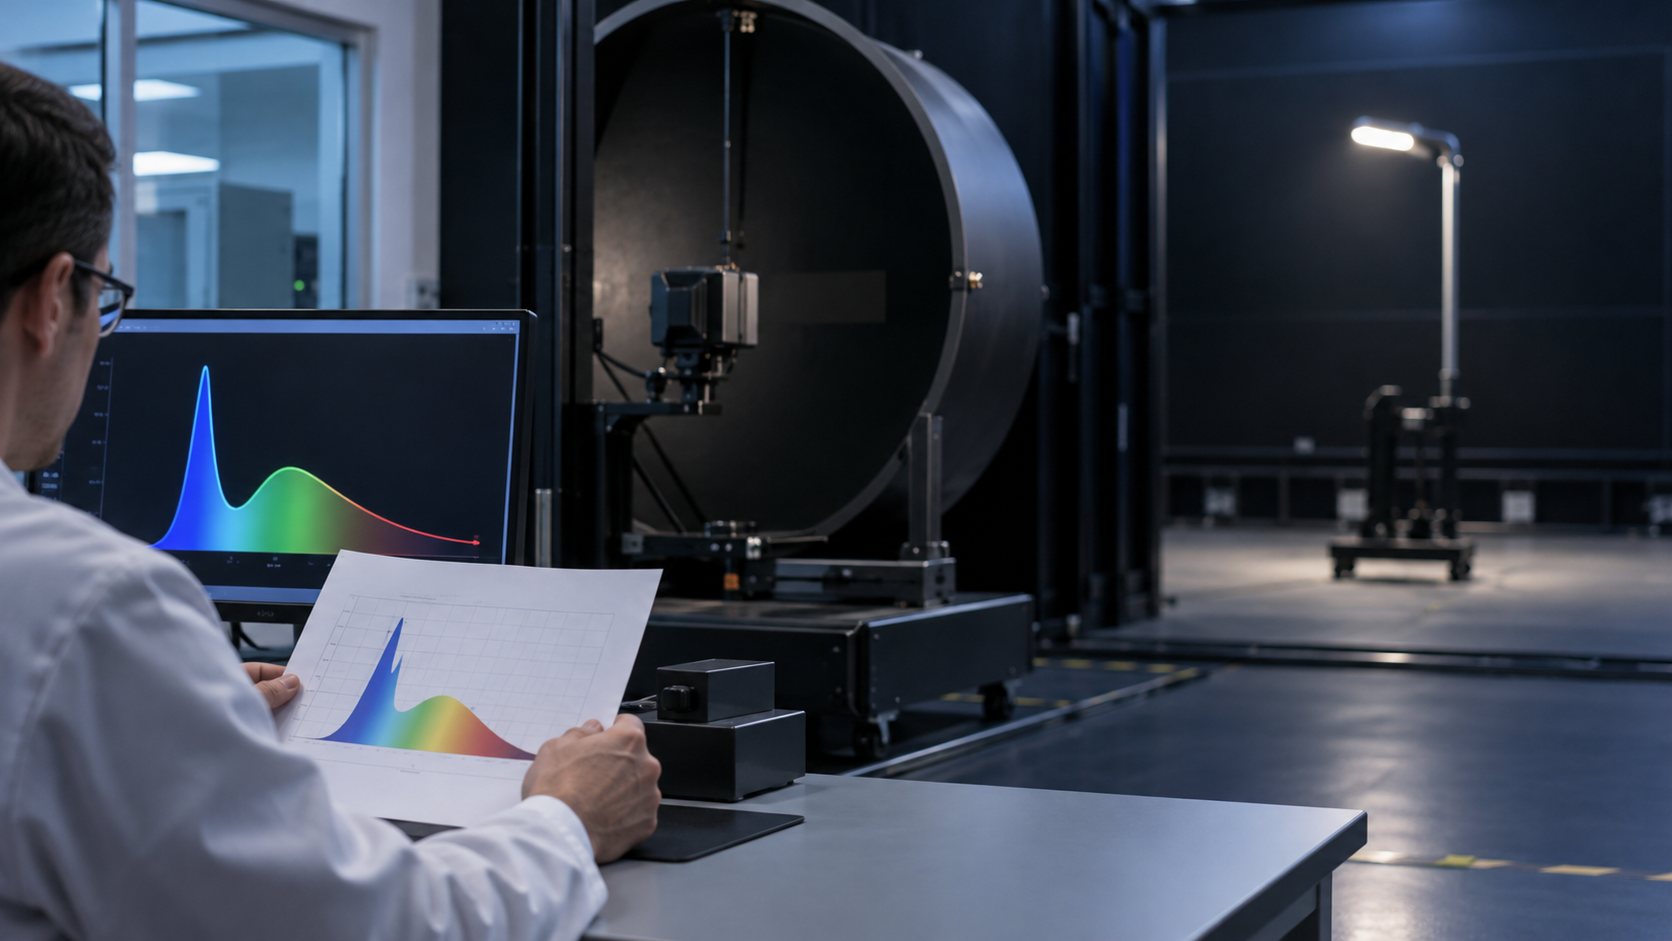
A worked example: define the band before doing the math
Teaching example only: suppose an internal comparison defines its blue band as 400–500 nm and its reference range as 380–780 nm. These ranges are chosen for this example; they are not a universal definition, ecological threshold or product specification.
Integrate the measured spectral power over each stated range, then divide the band power by the reference-range power:
Selected-band share (%) = power in 400–500 nm ÷ power in 380–780 nm × 100.
| Hypothetical report | 400–500 nm | 380–780 nm | Selected-band share |
|---|---|---|---|
| A | 12 W of optical power | 60 W of optical power | 20% |
| B | 6 W of optical power | 60 W of optical power | 10% |
Under those assumptions, B has a smaller share in the selected band. That is all the calculation establishes. It does not show that B meets a wildlife requirement, delivers equal illumination or is suitable for the same roadway. The watts here are radiant optical power, not fixture electrical input or lumens.
For discrete SPD data, the calculation also needs a documented integration method and wavelength spacing. Keep the band limits, denominator, units and operating condition with the result so another reviewer can reproduce it.
Why two similar CCT labels can still need separate review
Correlated color temperature compresses color appearance into one descriptor. It does not preserve the spectrum’s shape. Comparing CCT alone can therefore miss differences in the wavelengths relevant to a project.
Three other questions should remain separate:
- Photobiological safety: use the applicable safety assessment and measurement conditions.
- Ecological response: use the relevant species or habitat method and project criterion.
- Lighting performance: evaluate distribution, light level, glare and operating hours.
The CIE photobiological-safety publication addresses a different evaluation from a simple band percentage. Avoid placing the two results in one comparison column as though they mean the same thing.
What to put beside each spectrum in a submittal
A graph becomes much more useful when its identity travels with it. Record the model and optical assembly, selected CCT or channel, dimming state, test method, units, report date and revision. Include geometry and environmental conditions where the method requires them.
Then write the decision on the same page: which metric applies, who set the acceptance criterion and whether the reports are comparable. If the criterion has not been selected, settle that before asking bidders for a single “blue-light number.”
Spectrum is one part of the installation
A carefully selected spectrum can still send unwanted light into habitat if the fixture is aimed badly or operates unnecessarily. Review spectrum together with shielding, direction, output and schedule. For context, see DOE’s Light at Night overview and the related site-assessment guide.
Why a lux reading cannot supply a blue-light percentage
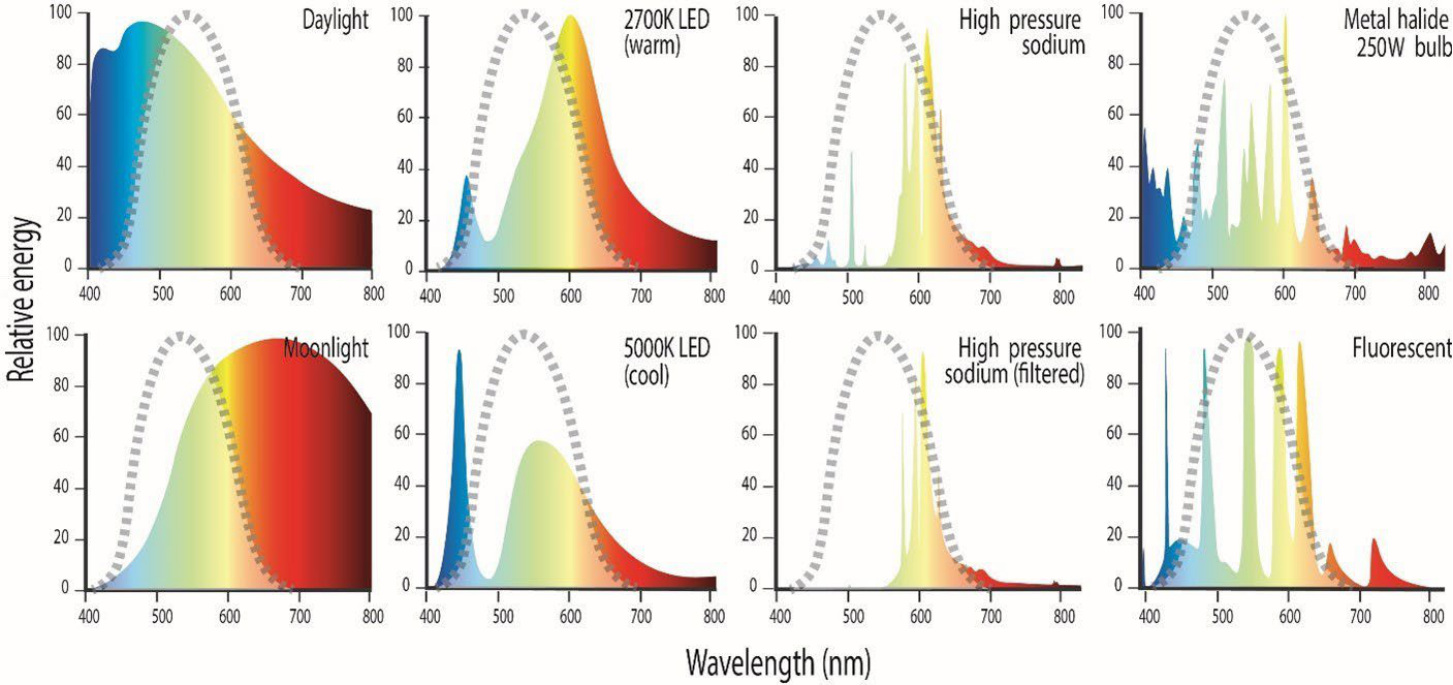
Photometry weights light according to a defined human visual response. A lux meter reports illuminance on its receiving plane; it does not return a wavelength-by-wavelength power distribution. Two sources can deliver the same illuminance while differing in spectral content. Conversely, a spectrum alone does not tell a reviewer the illuminance delivered to a road or the exposure at a habitat edge.
On small screens, swipe the diagram sideways to read its labels, or open the full-size image below.
Open full-size diagram
The Australian Government’s Figure 26 compares source spectra with the CIE photopic response. Its practical lesson is that a human-weighted quantity and an unweighted spectral quantity answer different questions. The illustration is not a model of every animal’s visual sensitivity, and it supplies neither a product ranking nor a universal acceptable blue-light percentage. See Appendix C, printed pp.36–38, for the discussion of biologically relevant measurement.
Keep source-output measurements separate from site measurements. Total spectral radiant flux of a complete luminaire can be reported in watts per nanometer. Spectral irradiance at a receiver uses watts per square meter per nanometer. Spectral radiance includes direction and solid angle. Dividing quantities from different measurement bases does not produce a meaningful comparison just because both datasets have a wavelength axis.
A smaller percentage can accompany more band power
A percentage hides the denominator. Extend the teaching example to include a third hypothetical luminaire: it emits 15 W in the selected 400–500 nm band and 150 W over the selected 380–780 nm reference range. Its share is 10%, matching report B above, but its band output is 2.5 times B’s 6 W. A lower share than A does not mean less absolute output in the band.
| Hypothetical source | Band radiant flux | Reference radiant flux | Share |
|---|---|---|---|
| B | 6 W | 60 W | 10% |
| C | 15 W | 150 W | 10% |
This table is an original arithmetic example, not measured LEOTEK data. It holds the chosen wavelength definitions constant to isolate the denominator problem. It does not hold roadway illuminance, distribution, mounting or receiving-point exposure constant. Those require additional design and measurement information.
Ask the supplier to report the share and its absolute basis together when the project needs both. If only a relative SPD is supplied, the common scale cancels in a consistently calculated within-spectrum ratio, but it cannot establish total radiant output. That is the distinction between a reproducible fraction and a complete exposure assessment.
Make a discrete-data calculation reproducible
A chart image is a useful overview; the underlying tabulated spectrum is the better calculation record. Request wavelength values, spectral values, units, spacing, normalization and any preprocessing. Preserve the original file alongside the calculation rather than manually tracing a compressed plot.
For a common numerical approach, sum the areas of adjacent wavelength intervals using trapezoidal integration: each interval contributes its wavelength width multiplied by the mean of its two endpoint values. Apply the same documented method to the selected band and reference range. When a boundary falls between samples, state how the boundary value is obtained. Do not silently round 497 nm to 500 nm or omit an interval because the data spacing is inconvenient.
The numerator and denominator must come from the same measurement and compatible units. A dataset sampled every nanometer cannot be compared with another dataset by simply adding both columns if their spacings differ. Likewise, a spectrum sampled per unit wavelength must not be treated as though its values were per unit frequency. Keep the wavelength basis explicit.
Data near the instrument’s detection limit also need care. Baseline subtraction, stray light, spectral bandwidth and wavelength calibration can matter when a proposed limit is very small. Ask the laboratory how uncertainty and below-detection values are reported. Replacing every small negative corrected value with zero without documenting the treatment can change a band integral.
Measure the proposed operating configuration
Record the complete orderable configuration: source option, optical assembly, filter, driver and any independently controlled channels. A report for a bare emitter does not necessarily characterize light leaving the assembled luminaire. A family name and a nominal CCT leave that identity unresolved.
If the comparison covers multiple operating states, obtain evidence for those states or a justified explanation of their relationship. Do not assume that a tunable or multichannel system retains one spectral shape at every setting. For a fixed-channel source, verify the claim rather than automatically treating every dimming level as a new color spectrum. The report should describe the test state actually used.
Also identify thermal stabilization and the laboratory’s measurement geometry and method. These details help a reviewer decide whether a difference belongs to the proposed equipment, the operating state or the test arrangement. Ask for the report date and revision so a later substitution can be checked against the same basis.
Match the metric to the ecological question
A selected-band fraction is descriptive. A species-weighted calculation is a different metric: it applies a stated spectral response function, and its meaning depends on the organism, endpoint and evidence behind that function. Do not call a generic 400–500 nm fraction a wildlife-impact score.
If the project uses a biological weighting, retain the function, version, wavelength coverage, units and normalization with the result. Identify what response it represents and whether the source-output calculation is being used as a screening tool or as part of a receiving-point exposure model. A named species is not enough if the measured endpoint and conditions are missing.
Nor is a blue-band percentage a photobiological-safety result. Safety assessments use their own weighting functions, quantities and exposure conditions. Keeping those reports separate prevents a favorable result under one method from being presented as proof under another.
For the broader selection decision, read SPD versus CCT. To carry the spectral requirement into a tender, use the ecological specification guide. The useful output is a comparable evidence package, not an unsupported single-number ranking.
A quick check before accepting the report
Open the spectral data and the comparison sheet together. Confirm that the configuration identifiers match, the wavelength range covers both integrals, and the units are stated. Recalculate one reported fraction from the original values. A result that cannot be reproduced should remain an open submittal item rather than become an accepted product attribute.
If the two suppliers used different bands, ask for a common calculation from compatible data. If one supplies only normalized curves and the decision requires absolute output, request the missing absolute measurement. If the project criterion is still undefined, record that decision gap; selecting the smaller percentage will not resolve it.
Retain the review in a short record: metric definition, report identities, calculation method, result, limitations and reviewer. That record lets a replacement or revised configuration be assessed on the same basis later. It also prevents a useful screening percentage from gradually becoming an unsupported claim about wildlife protection.
Questions about blue-light reports
Is 3000K proof of low blue-light content?
No. Ask for the SPD and a stated comparison method. CCT alone cannot establish a band percentage or a species-specific response.
Can we compare two percentages from different suppliers?
Only after checking that the wavelength bands, denominator, test basis and operating conditions match. Otherwise, the percentages may answer different questions.
Which percentage is acceptable near habitat?
The teaching example above sets no acceptance limit. The applicable habitat review, authority and project documents must identify the relevant method and criterion.
Explore ECOridge ecological-lighting concepts. For a product review, ask LEOTEK for configuration-specific spectral documentation and include the calculation or project criterion you need to evaluate.
Sources and further reading
- Australian Government DCCEEW, National Light Pollution Guidelines for Wildlife, Version 2.0 (2023). Figure and appendix references are identified beside the relevant discussion. This is Australian technical guidance, not a U.S. roadway standard.
- DarkSky International and Illuminating Engineering Society, Five Principles for Responsible Outdoor Lighting.