





A lighting calculation can meet the roadway target while leaving the most important crossing short of its target. The useful question is where the shortfall occurs and which design change addresses it. Increasing the output of every luminaire is one option, but it is not automatically the most effective next step.
FHWA’s Pedestrian Lighting Primer provides a worked example that makes this tradeoff unusually clear. A higher-wattage iteration improves much of the site, yet two intersection crossings still fall short. Changes to pole positions and mounting heights then resolve those locations. The example is a published design simulation, not a field trial or a test of a LEOTEK product.
Begin with the destinations and crossing tasks
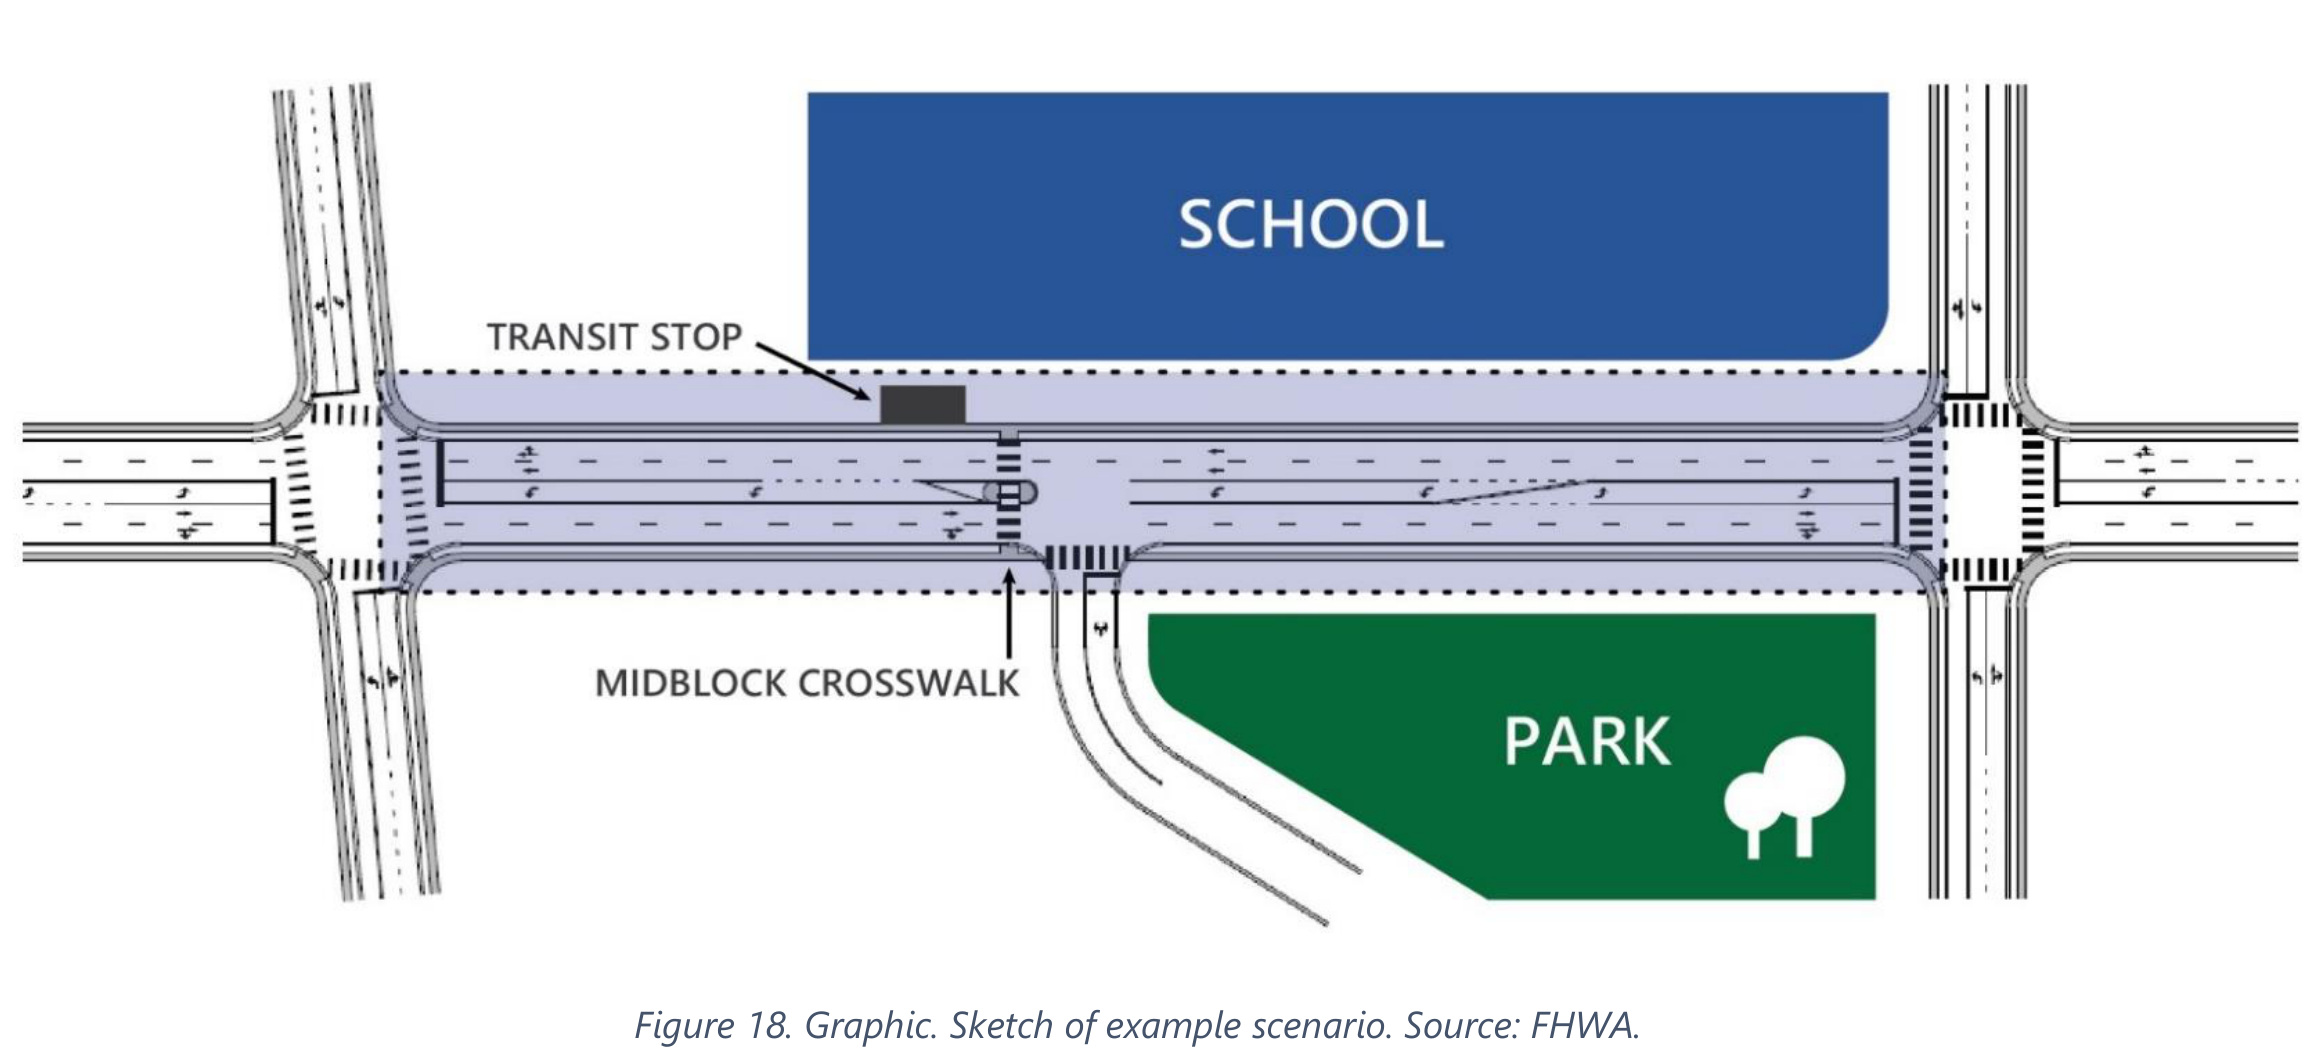
Figure 18 shows a school, a park, a transit stop, intersections and a midblock crossing. These are not interchangeable parts of a calculation grid. The roadway carries vehicles; the sidewalk serves people moving along the road; the crossings require drivers to detect people traveling across it. One average value cannot describe all three tasks.
Start a project sketch with the routes people actually use. Identify where someone waits, enters the road, reaches a refuge or walks toward a bus stop. Record trees, signs, parked vehicles, driveways and building entrances. A pole layout that looks evenly spaced on a plan may place a shadow or a visually distracting source at one of those critical positions.
The background belongs in the site review
Figure 21 shows the research mannequin outlined in green among a sidewalk, bicycle, sign and other objects. A golf cart simulated a structure behind the target. The experiment makes a useful site-review question visible: what will the driver see behind the person, from the approach direction?
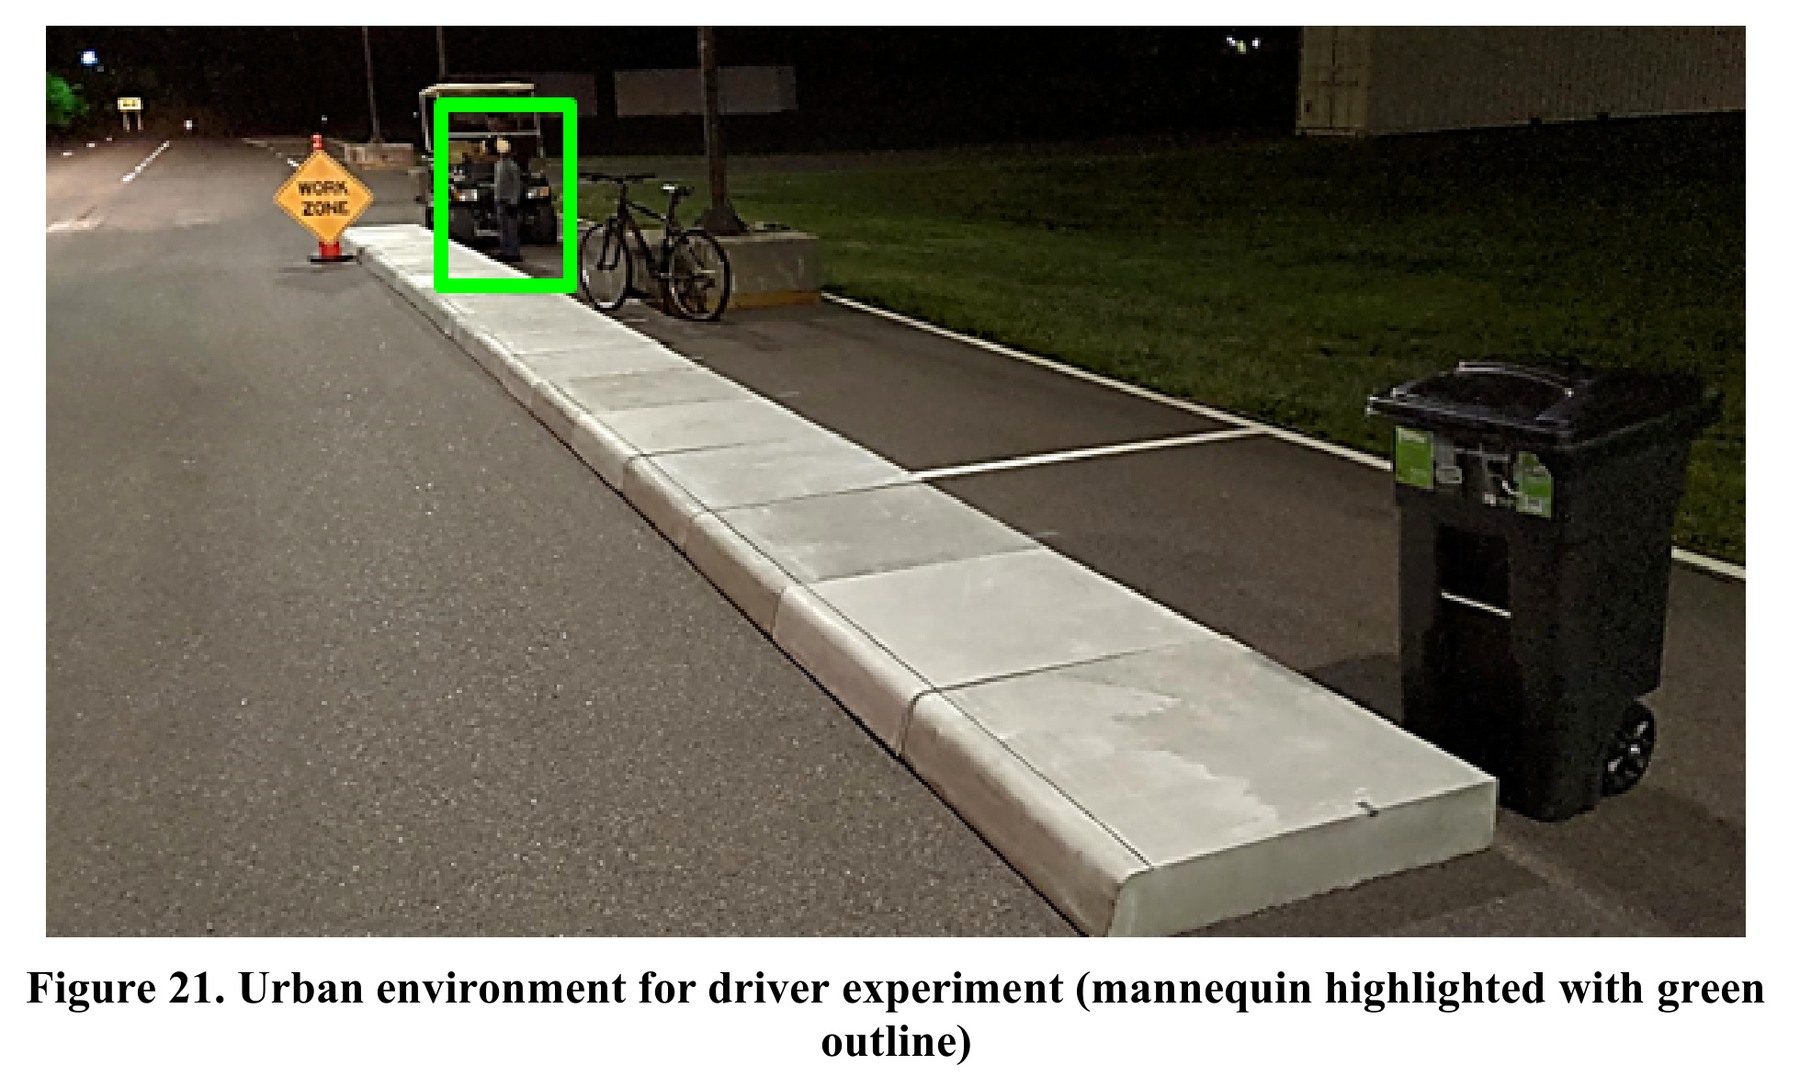
Record the background from the observer’s position as well as the target location on the plan. Keep the approach, target and backdrop in the same observation record so a later reviewer can understand the visual task. This was a simulated urban test setting, one urban location alongside four rural locations, rather than a documented LEOTEK installation.
The FHWA example is valuable because the design process stays tied to that scenario. It does not begin with a chosen luminaire wattage and ask where to put it. For a retrofit, retain the existing supports and utilities as constraints, but show which crossing tasks the proposed change is meant to improve.
Use the metric that describes the task
Horizontal illuminance measures light arriving at a horizontal plane. Vertical illuminance addresses light arriving at an upright plane, which can matter when a driver needs to see a person. Semi-cylindrical illuminance is another receiving geometry used in pedestrian evaluation. These measures are not different names for the same meter reading.
A meter's receiving geometry changes the reading
The researchers measured the target locations with a vertical Konica Minolta T-10 meter and an Everfine Photo-2000EZ semi-cylindrical meter. Figure 26 plots their relationship. The vertical measurements were taken near the mannequin’s face, approximately 1.2 m above the ground and facing the observation direction. The wider receiving angle of the semi-cylindrical instrument produced higher values.
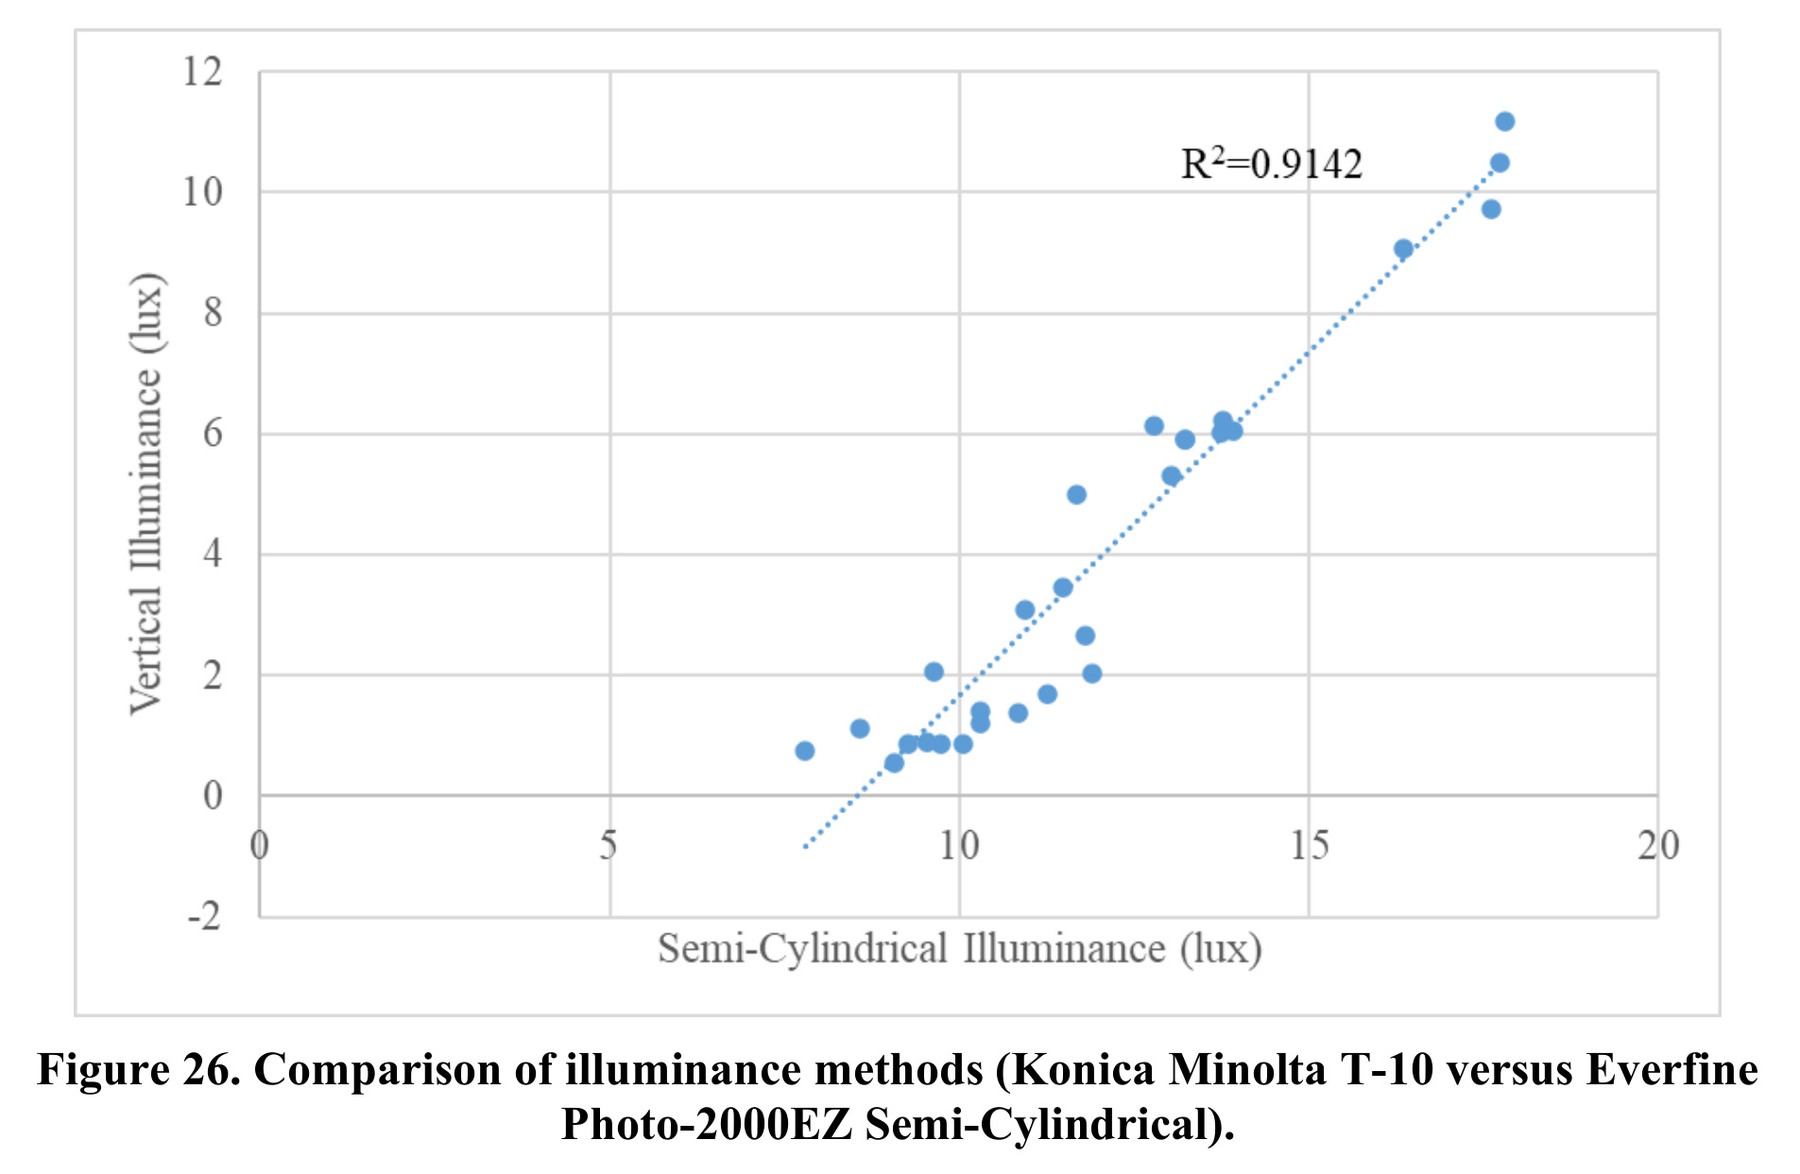
The reported R2 of 0.9142 describes this dataset. A strong relationship is not the same as equal readings: the two axes describe different receiving geometries. Keep measurement height, orientation and instrument with each reading. Do not use this fitted relationship as a general conversion for a different site, instrument or lighting arrangement.
The primer’s example evaluates vertical illuminance at crossings, semi-cylindrical illuminance on sidewalks and luminance on the roadway. Luminance describes light leaving a surface toward a specified viewing direction; its unit is candela per square meter. A lux value for one plane cannot be compared directly with a roadway luminance value.
Agree on the calculation areas, orientations and relevant criteria before comparing products. Keep the geometry of the receiving plane with each result. A proposal that reports “average light level” without saying what was calculated can conceal a mismatch between the metric and the road user’s task. See the measurement and glare diagrams in the security-lighting guide.
Mounting height and distribution belong in the same discussion
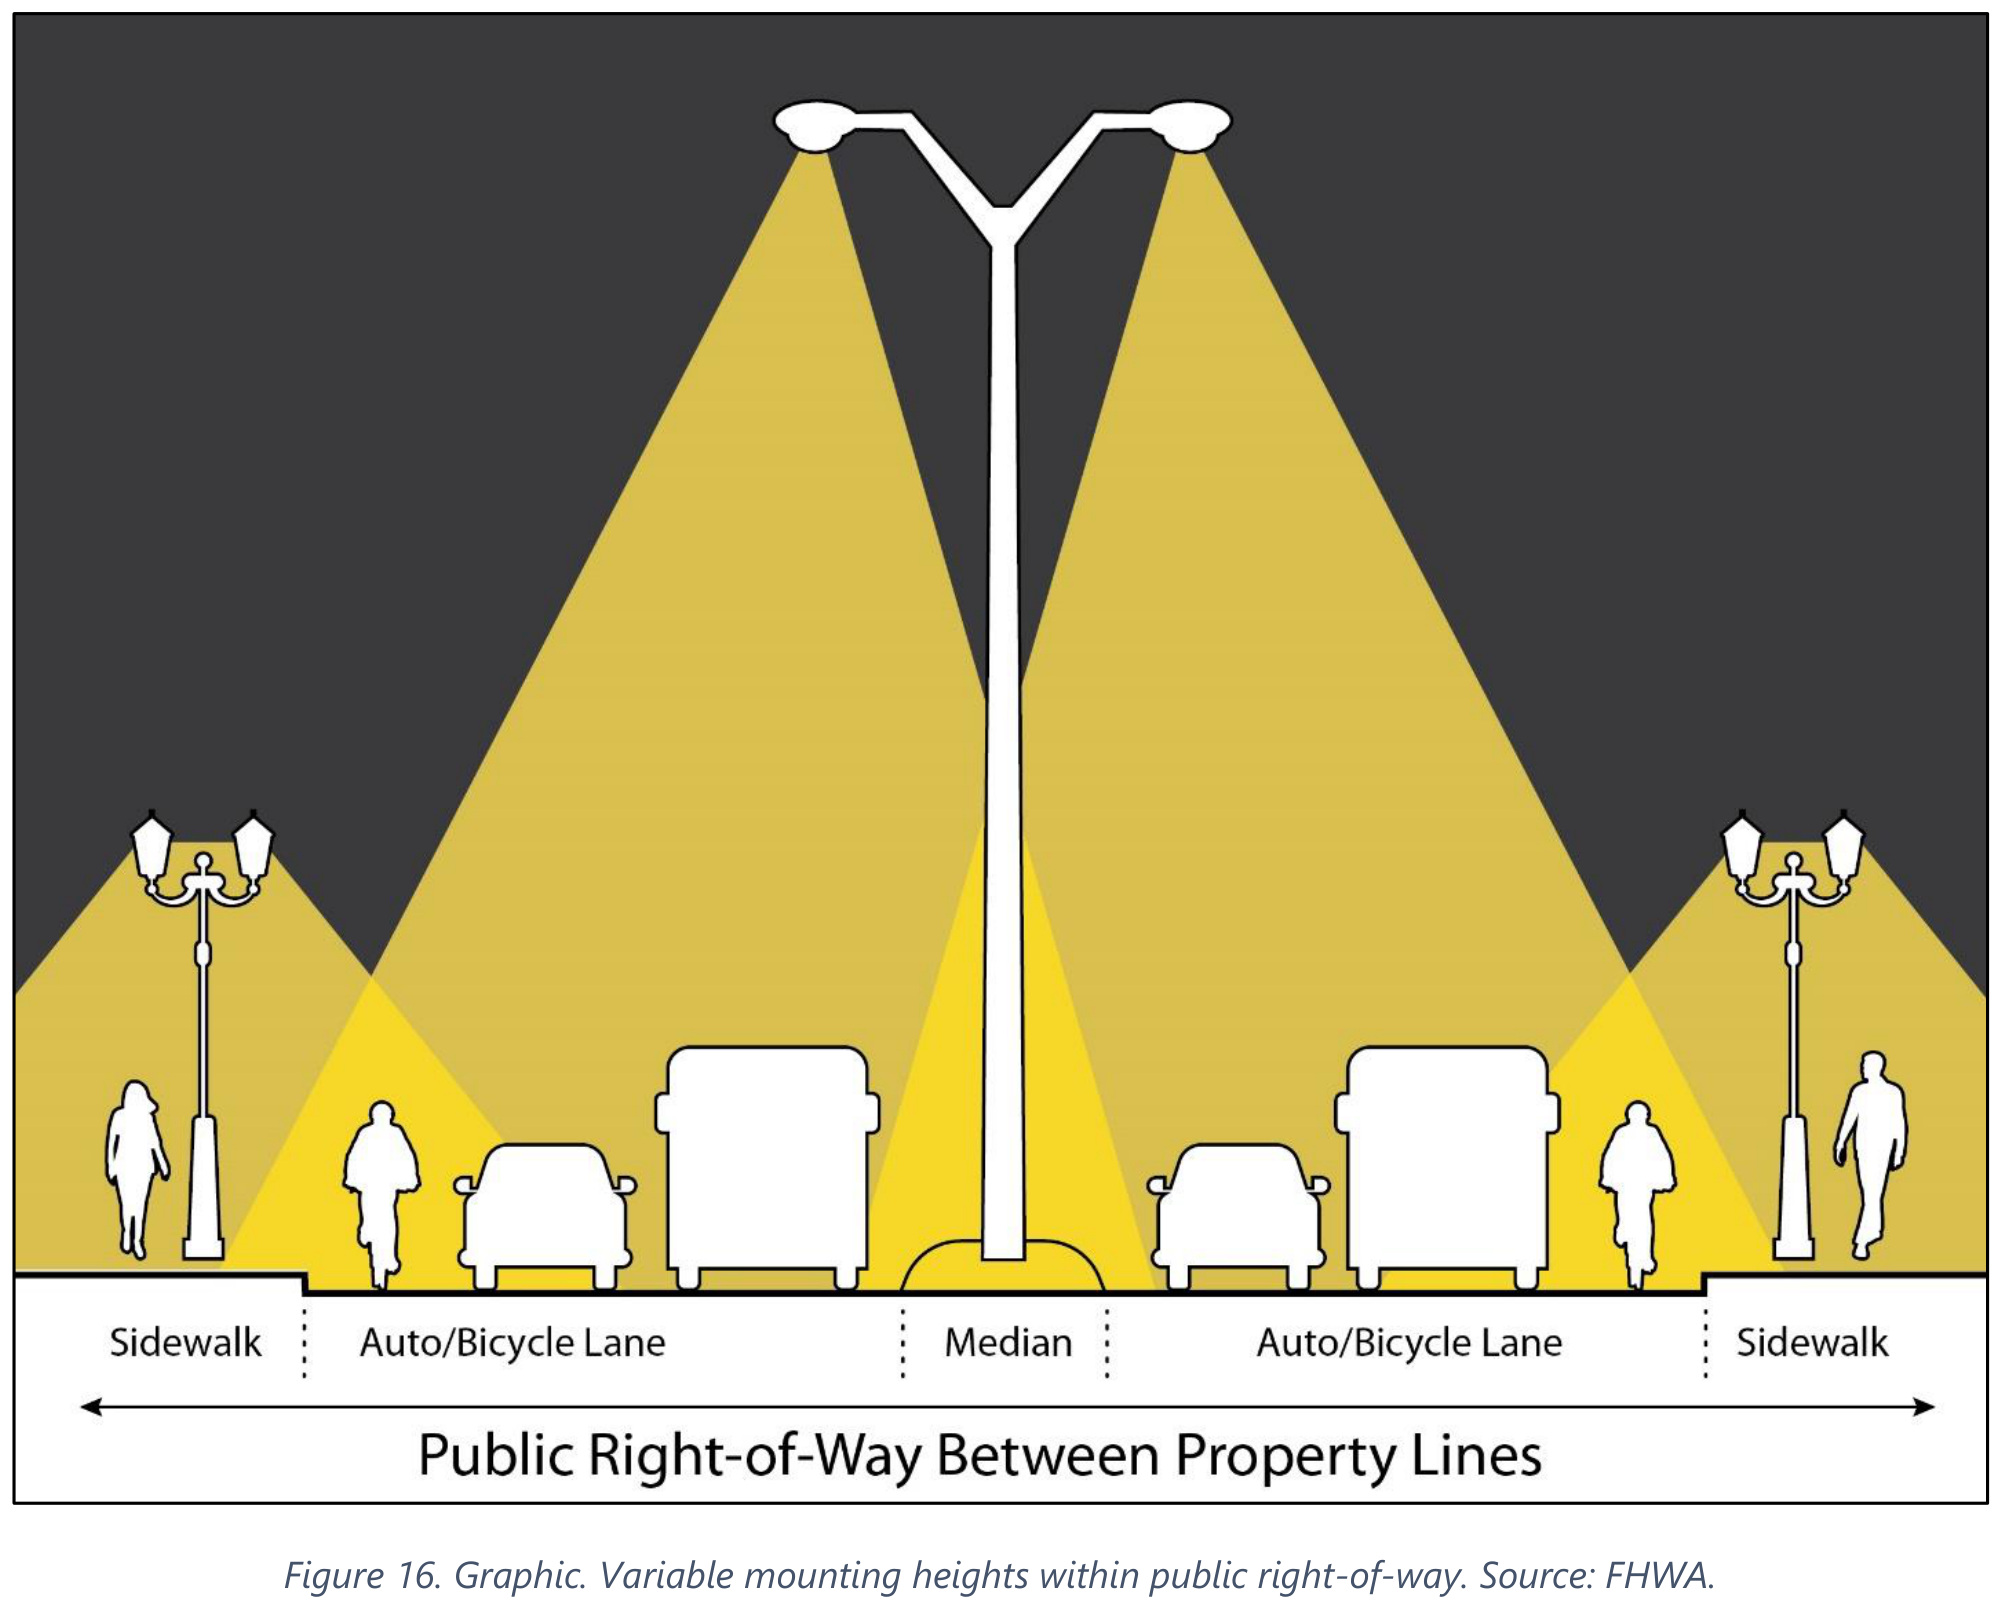
Figure 16 contrasts roadway and pedestrian-scale mounting arrangements within the public right-of-way. It illustrates a design relationship, not a universal height or spacing rule. Actual performance depends on the luminaire’s distribution, its position relative to the receiving area, the mounting height and the surrounding obstructions.
A lower mounting height may change the relationship to a person, tree canopy or building frontage, but it can also affect spacing and source visibility. A taller pole may serve a wider road area while leaving a different task near the sidewalk unresolved. Check the candidate configuration with its actual photometric file rather than treating height as an isolated specification.
For product selection, compare the exact optical distribution and output configuration used in the model. A family name, nominal wattage or photograph cannot establish that two IES files describe equivalent light delivery. Include the mounting orientation and any accessories in that comparison.
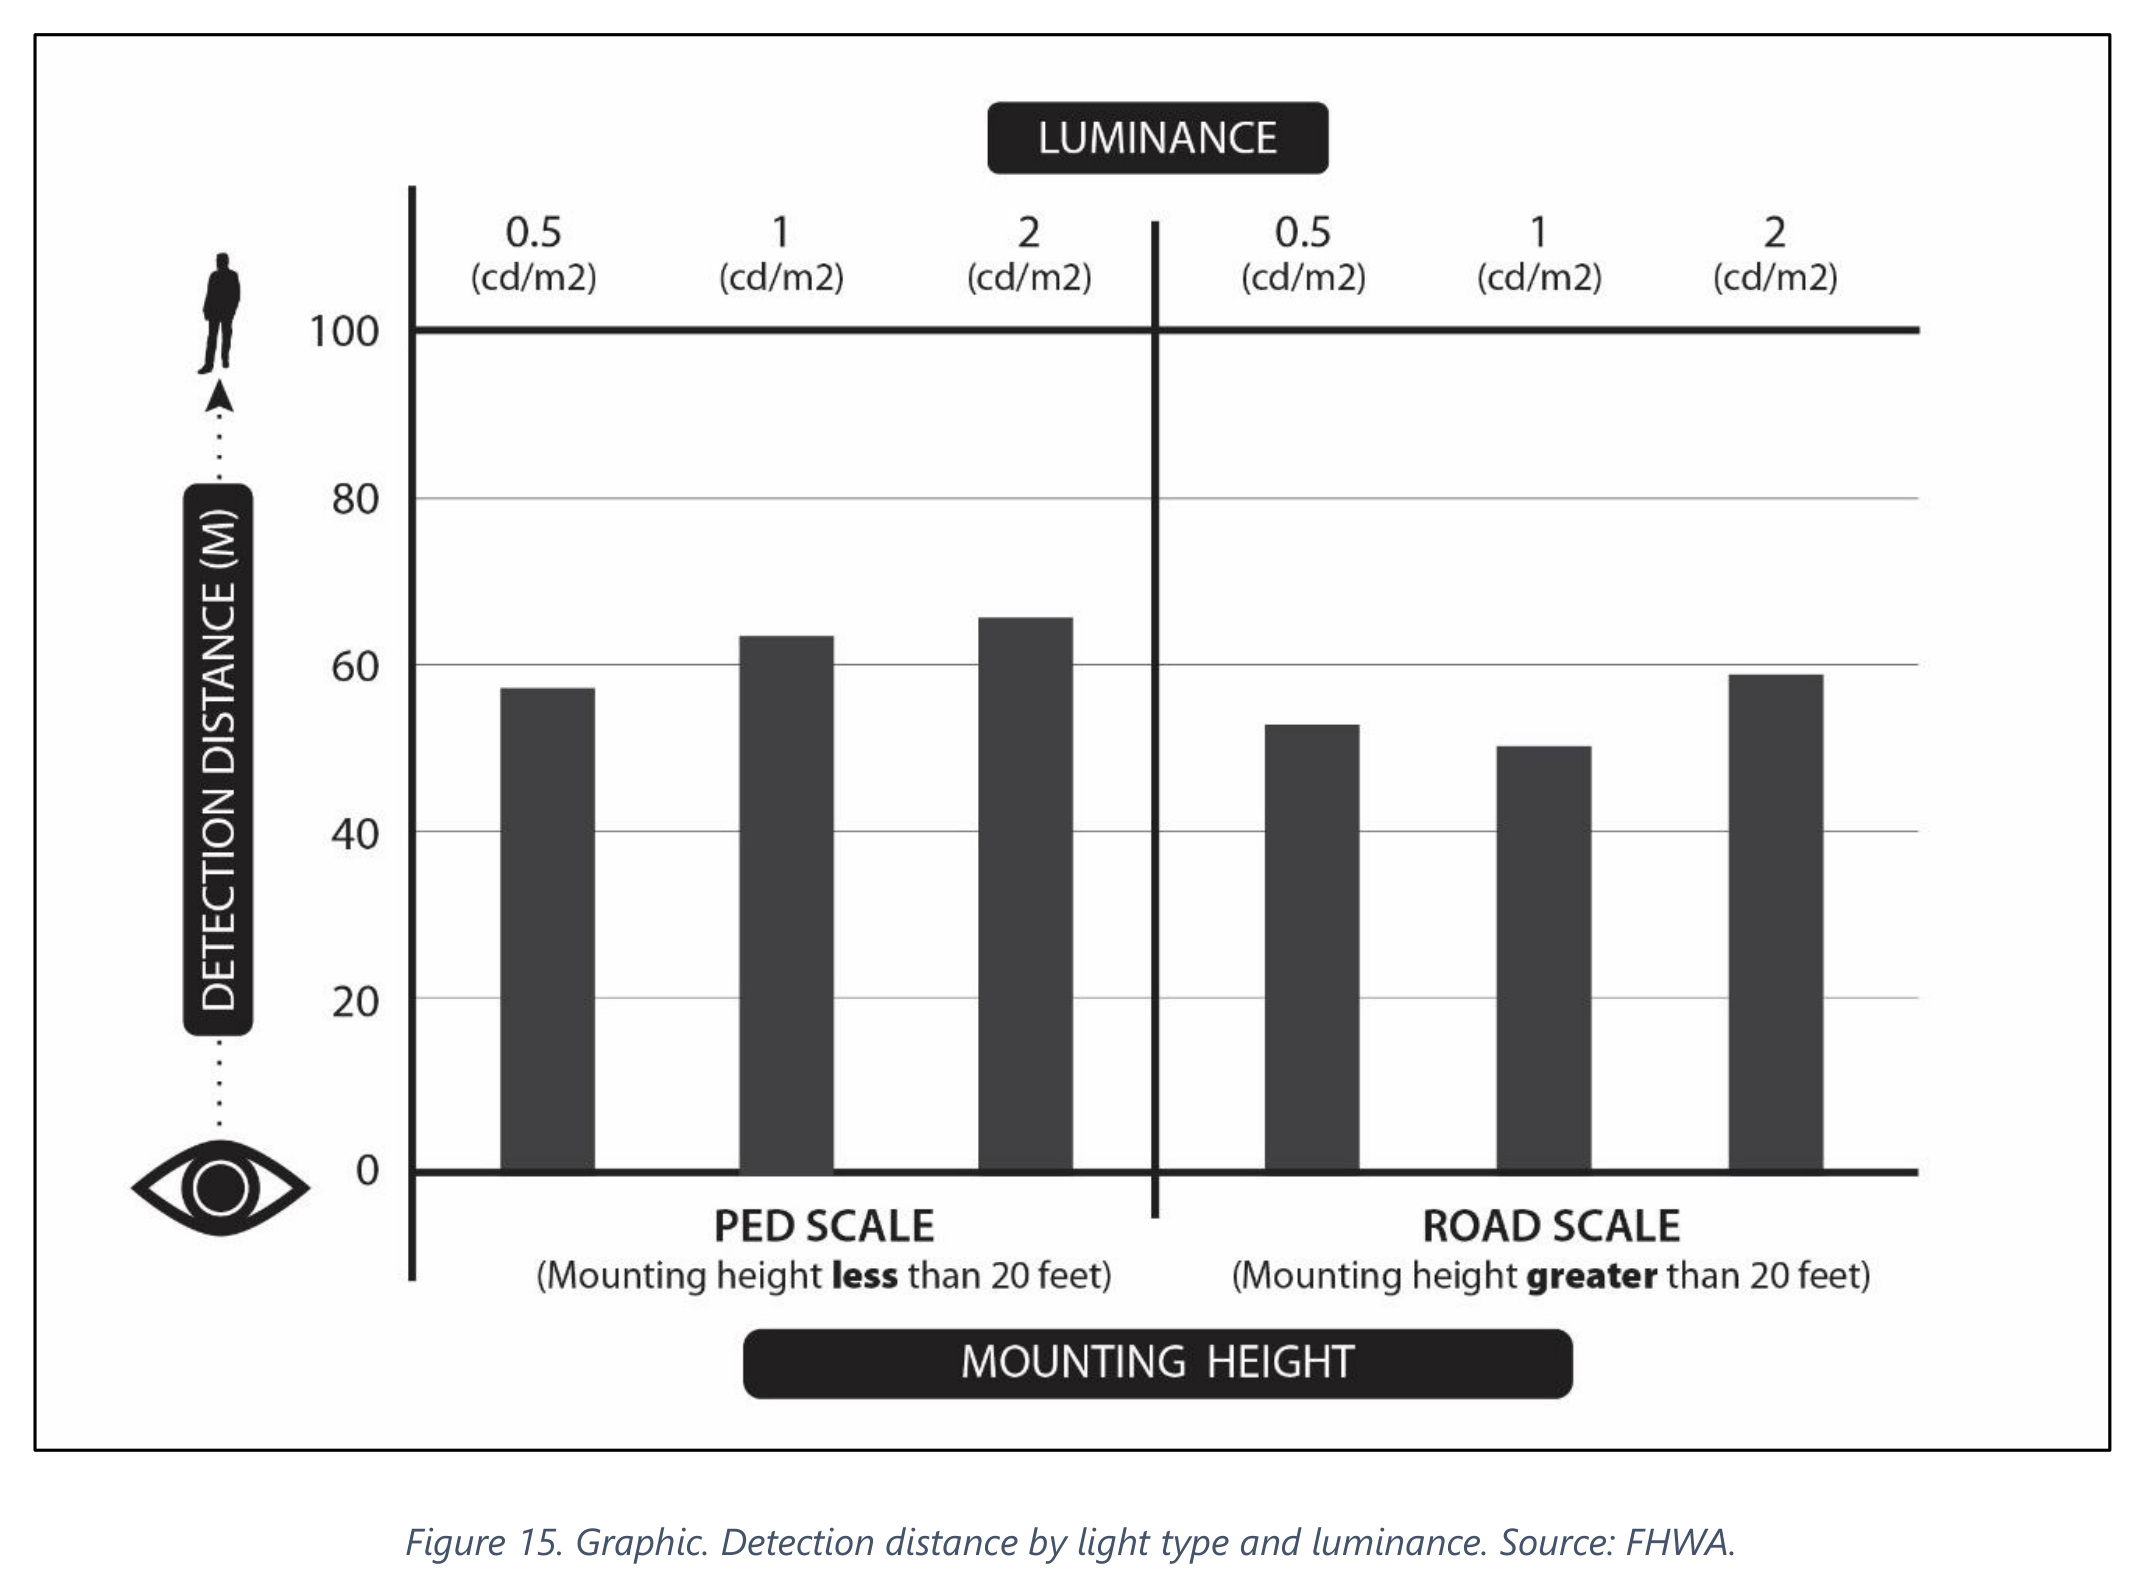
The research behind Figure 15 compared complete pedestrian-scale and road-scale lighting arrangements. The primary report describes a driver task involving child-sized mannequins and notes that repeated trials introduced a learning effect. This adds evidence to the mounting-height discussion, but it does not prove that lowering every pole improves visibility or establishes a required height. Read the original research context before transferring the comparison to another street.
Keep this experiment separate from the simulated design example below: they answer different questions. The experiment examines detection under its test conditions; the later calculation checks selected areas against that example’s design targets. For the related question of spectrum, see how to read CCT and pedestrian-visibility research.
Place the constrained crossing luminaires first
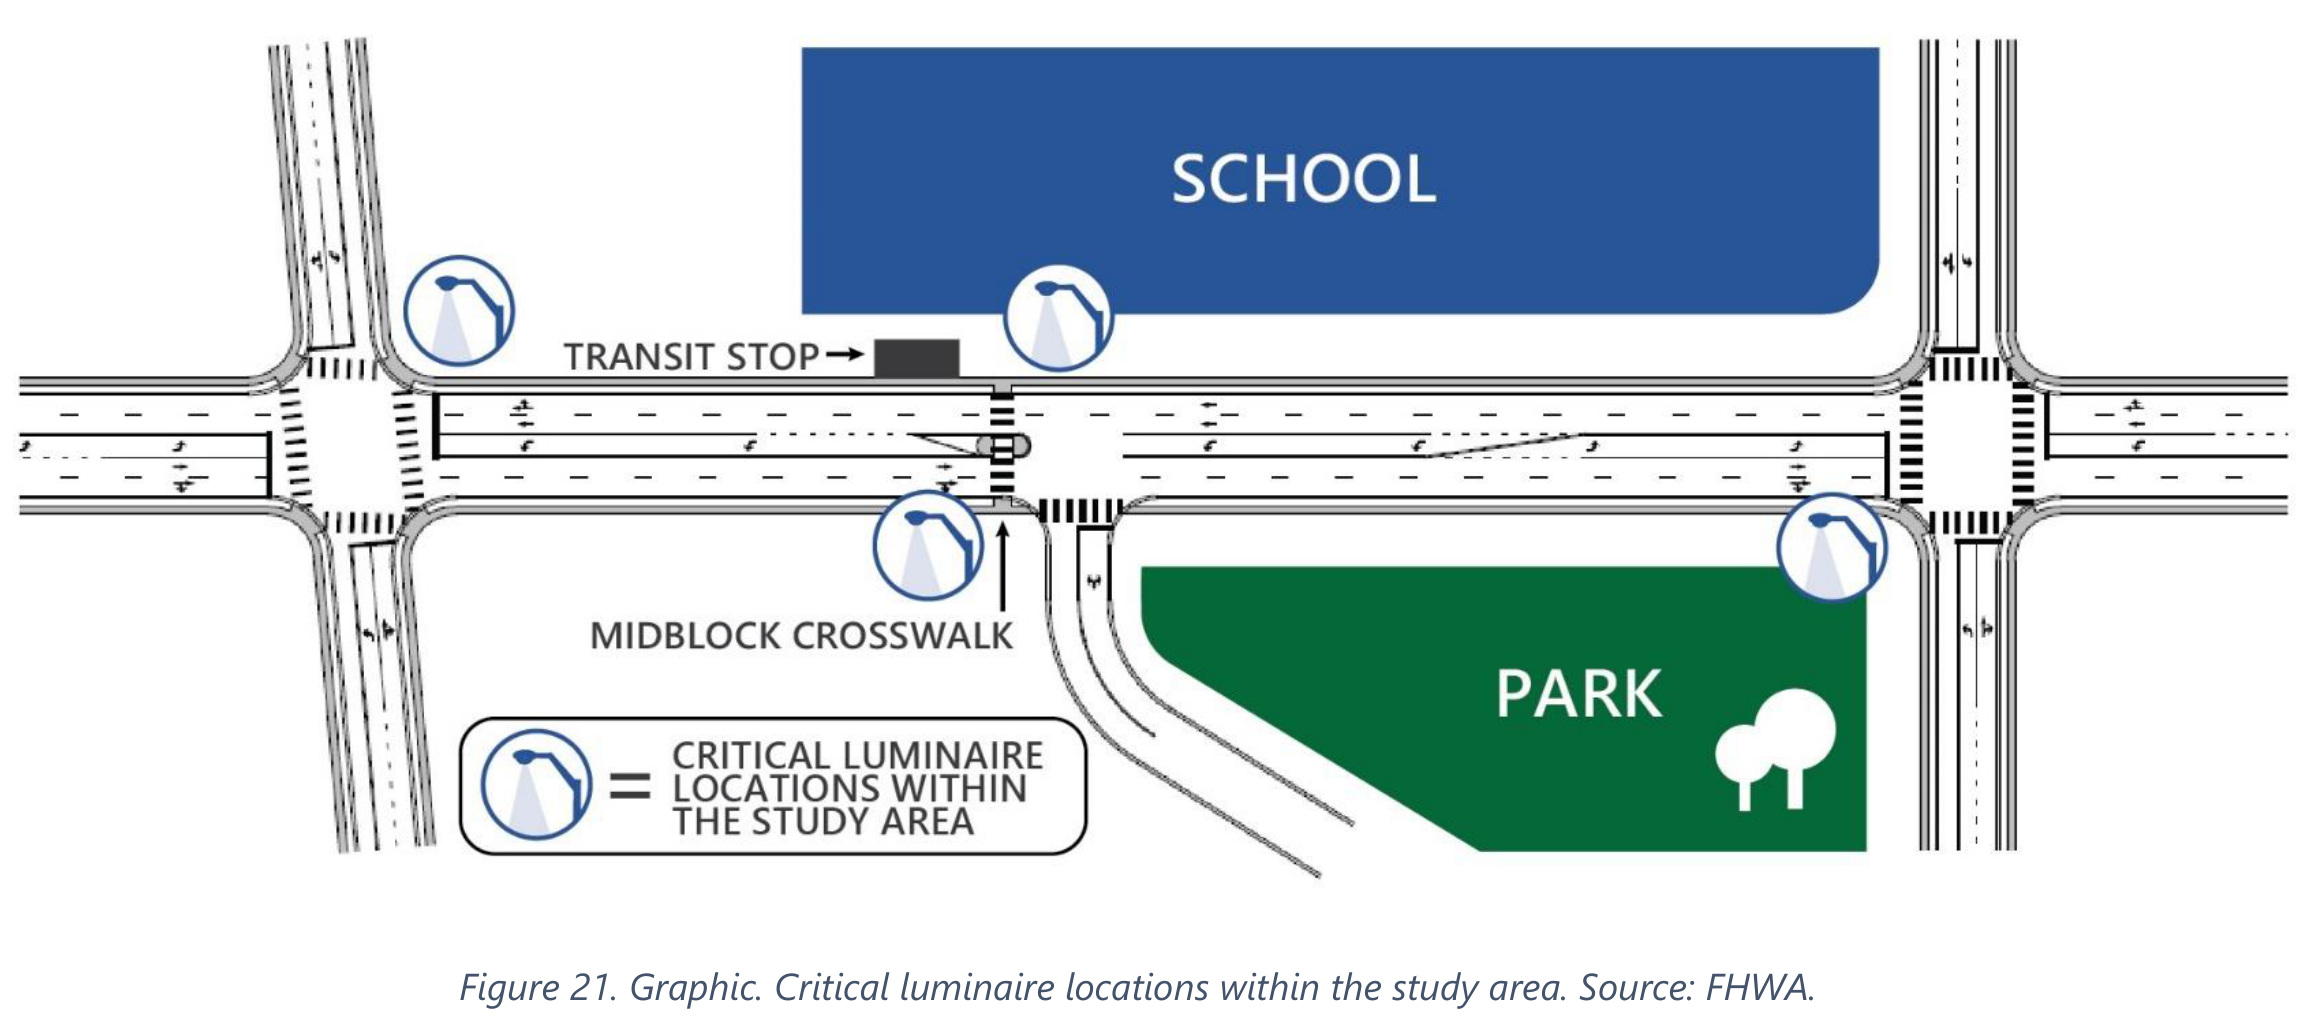
The primer first identifies critical luminaire locations at the midblock and intersection crossings. It places crossing luminaires in advance of the crosswalks to create positive contrast, then fills the remaining roadway segment with a staggered layout. The approach is more informative than beginning with an equal-spacing pattern and accepting whatever happens at the crossings.
Figure 21 highlights those critical positions. The diagram should be read with the direction of travel and the crossing location. “In advance” is a relationship to the approaching driver, not a fixed side of the page. A two-way road requires attention to the view from both directions.
The report’s approximately 200-foot spacing is a starting point within its example. It is not a recommendation to place all roadway poles 200 feet apart. Site width, distribution, output, height, constraints and the selected criteria determine whether a proposed spacing works. Preserve that distinction when using the illustration in a project discussion.
What the three calculation iterations reveal
The example begins with a 204 W luminaire configuration and then tests a 268 W configuration from the same manufacturer. The next revision changes selected pole locations and reduces the mounting height near the intersection crossings from 35 feet to 30 feet. The table below transcribes the published results.
| Calculation area / metric | Example target | Initial design | Higher-wattage iteration | Final geometry adjustment |
|---|---|---|---|---|
| Midblock crosswalk Vertical illuminance (lux) |
20 | 19.06 | 25.19 | 25.19 |
| Intersection crossing west Vertical illuminance (lux) |
30 | 19.26 | 25.46 | 30.87 |
| Intersection crossing east Vertical illuminance (lux) |
30 | 18.23 | 24.10 | 31.29 |
| Sidewalk north Semi-cylindrical illuminance (lux) |
10 | 7.63 | 10.09 | 10.02 |
| Sidewalk south Semi-cylindrical illuminance (lux) |
10 | 7.73 | 10.21 | 10.02 |
| Roadway westbound Luminance (cd/m2) |
2.0 | 1.92 | 2.53 | 2.54 |
| Roadway eastbound Luminance (cd/m2) |
2.0 | 1.92 | 2.54 | 2.56 |
Source: FHWA, Pedestrian Lighting Primer, Tables 5-7, printed pp. 39-41 / PDF pp. 47-49. Values are calculated design outputs. Targets belong to this 2022 worked example, which refers to IES RP-8-18; they are not presented as universal current requirements. The report also calls for evaluation of uniformity and glare.
The first important result is the incomplete response to more power. Raising input from 204 W to 268 W is approximately a 31 percent increase per luminaire. It brings the example’s midblock crossing, sidewalks and roadway averages above their listed targets. Yet the west and east intersection crossing averages remain at 25.46 and 24.10 lux against the example’s 30-lux targets.
The final local geometry adjustments raise those two values to 30.87 and 31.29 lux without another increase in the selected luminaire wattage. Those are approximately 21 and 30 percent increases from the preceding iteration, calculated from the published values. They are not measured safety improvements, energy savings or a prediction for a different street.
Separate a site-wide shortage from a local shortfall
When most calculation areas are low, a broader change to output, distribution or spacing may deserve investigation. When one crossing remains low while surrounding areas are satisfactory, inspect the geometry and distribution serving that crossing. The FHWA sequence shows why those two situations should not automatically produce the same purchasing decision.
Increasing all outputs again might improve a missed point while over-lighting areas that already meet their selected criteria. It can also change glare, energy use and light reaching neighboring property. A local adjustment has its own costs and constraints, but the comparison should be made before assuming that a larger wattage package is the least costly solution.
A useful design review asks the consultant to identify which change produced which improvement. Keep one input set stable while comparing a specific revision where practical. If optics, height, spacing, output and loss factors all change together, the final result may be acceptable, but the record will explain much less about why.
A rendering communicates the design; the calculation supports it
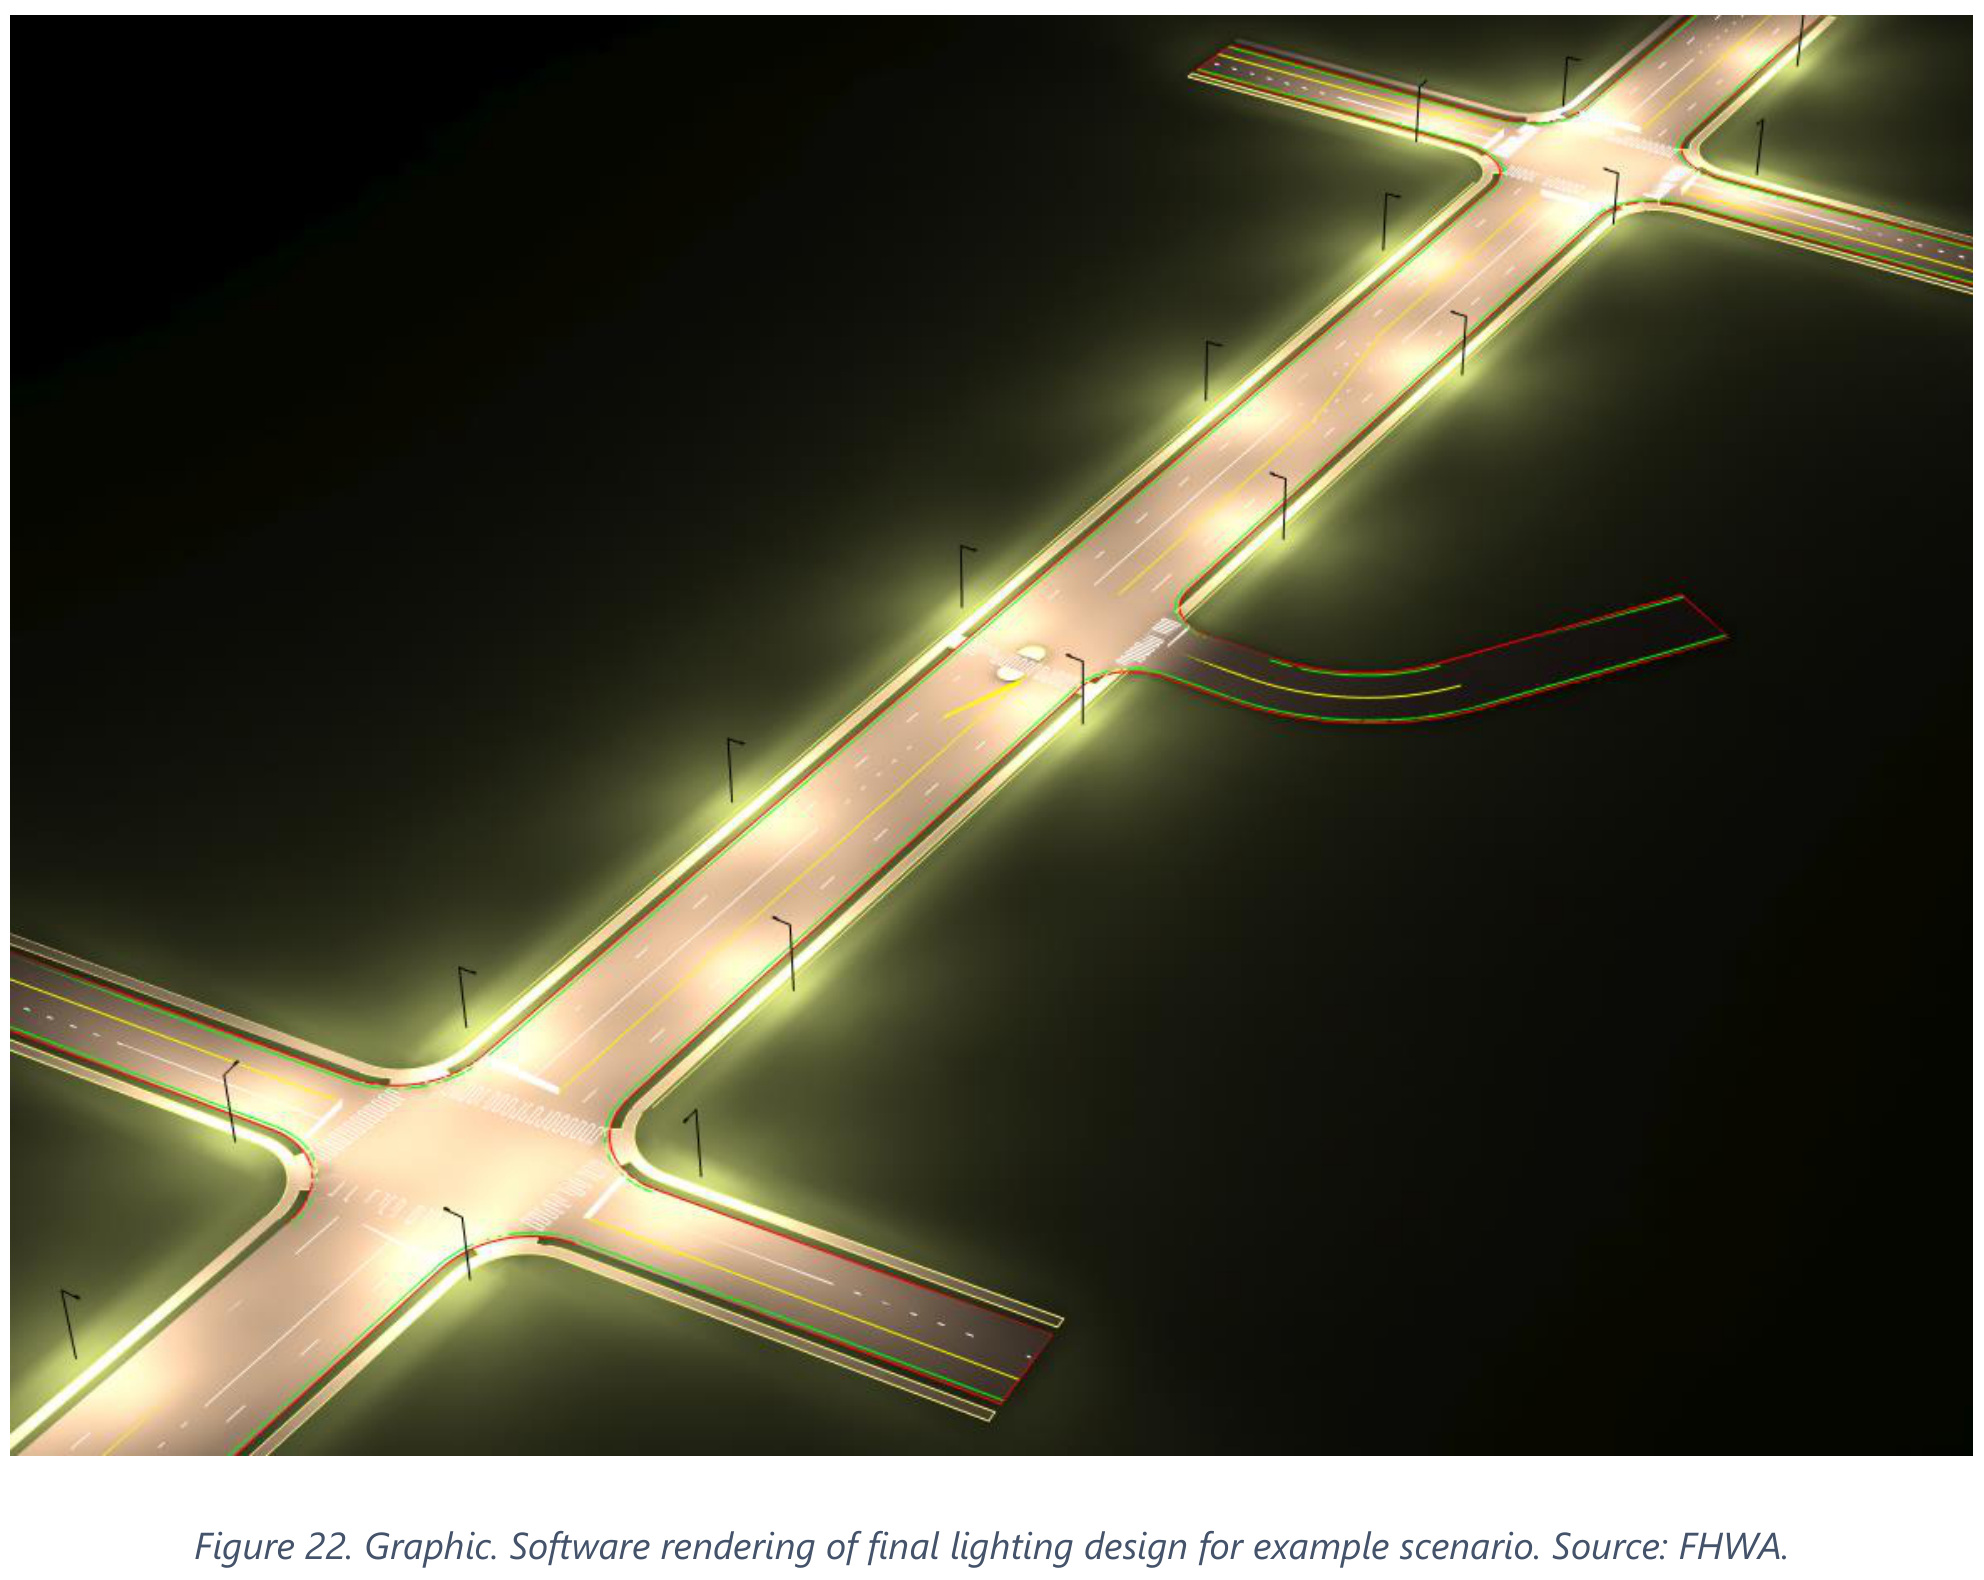
Figure 22 is the report’s software rendering of the final example. It helps people understand the relationship between luminaires, roadway and crossings. It is not a nighttime photograph, and a bright-looking patch in a rendering does not establish a field lux value or driver detection distance.
Retain the numerical calculation grids, their orientation, the photometric files and the model inputs alongside the rendering. The average values reproduced here are only part of that package. Minimum values, uniformity, glare and the governing project criteria also need review. A satisfactory average cannot identify every dark point or an uncomfortable view toward a source.
The primer uses a light loss factor of 0.85 in this example. That is an input to its calculation, not a blanket promise about every LED luminaire or maintenance environment. A project model should document the loss assumptions used and the maintenance conditions they represent.
Carry the accepted design into procurement and commissioning
Keep the accepted model configuration connected to the ordered catalog code. Record the optical distribution, output setting, mounting height, orientation and accessories, together with the corresponding IES file. If a substitute is proposed, review the calculation with that actual configuration. Similar wattage alone is not evidence of equivalent delivery to the crossing.
At commissioning, use an agreed observation and measurement plan that matches the model’s tasks. Identify the measurement location, receiving-plane direction, operating setting and background conditions. Check the approaching driver’s view and the pedestrian route as well as the meter reading. A field change in tilt or placement can matter even when the installed product label is correct.
Use the same coordinates for calculation and field verification
Figure 16 separates the roadway grids on the pavement from the sidewalk grid above it, and labels the meter aiming direction. The practical handover task is to keep the accepted calculation coordinates connected to the field measurement plan.
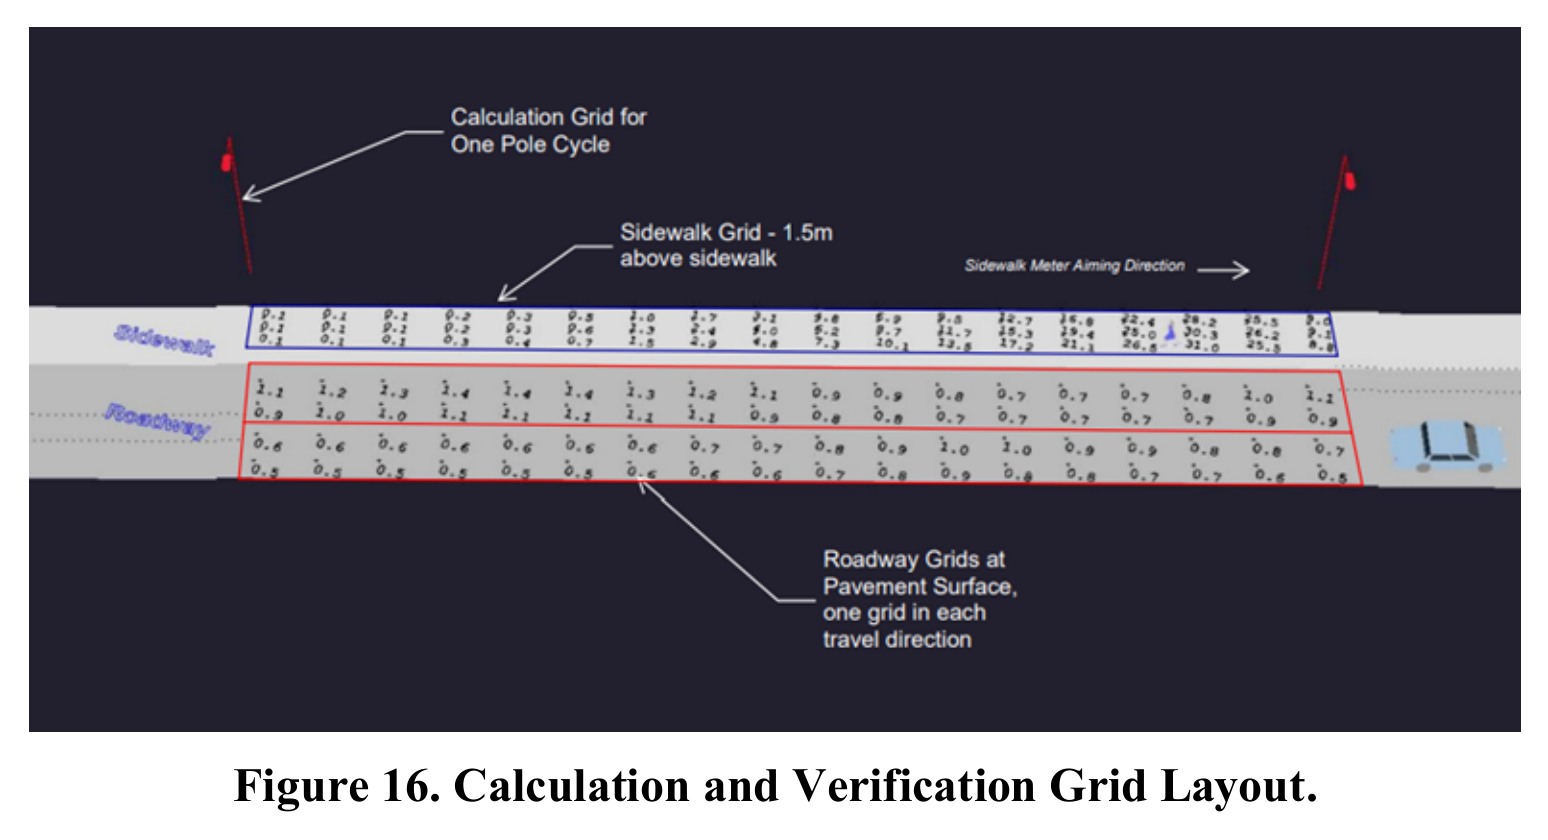
Notice the 1.5 m sidewalk plane in this layout. It is a different context from the approximately 1.2 m mannequin-face measurements discussed earlier. Copying a height without its task and receiving direction can create an apparent disagreement between calculation and commissioning.
For each accepted grid, retain point coordinates, measurement plane and height, receiving direction, instrument and luminaire operating state. A missed value then has a traceable location for review. This report illustration is a verification example; the project’s approved documents determine the governing criteria and final measurement arrangement.
Document unresolved constraints and responsibility for the follow-up. A tree canopy, obstructed support location or unexpected neighboring light source should not disappear from the handover because the rendering looked complete. The practical outcome is a traceable chain from the crossing task to the modeled configuration and then to the installed asset.
Frequently asked questions
Are 20 or 30 lux the required values for every crosswalk?
No. They are targets used in this published example. Determine the responsible agency’s applicable criteria and the project’s operating context. The example demonstrates a design process; its selected numbers are not a universal standard.
Does a higher-wattage option always solve a crossing shortfall?
No. In the FHWA example, increasing wattage improves several areas but leaves two intersection crossings below their selected targets. Local placement and mounting-height adjustments are then used to resolve those locations.
Can the final rendering be treated as a performance test?
No. It is a software visualization supported by a calculation example. Keep it separate from field measurements, laboratory photometry and any measured crash or detection outcome.
Which product information should accompany a lighting calculation?
The exact configuration and its photometric file, output setting, distribution, accessories, orientation and mounting assumptions. Carry those details into the submittal and installation record so the accepted design can be checked.
Sources
- FHWA, Pedestrian Lighting Primer, FHWA-SA-21-087, April 2022: Figures 15, 16, 18, 21 and 22; Sections 2.3, 2.5 and 3.6; Tables 5-7. Published simulation example and explanatory figures.
- Security lighting: measurement planes, viewing tasks and glare.
- Pedestrian signal warrants: control selection is a separate decision from lighting design.
Cover: AI-generated editorial illustration for LEOTEK, not a verified installation, product photograph or test record. Technical figures and the calculation table have separate FHWA source credits.