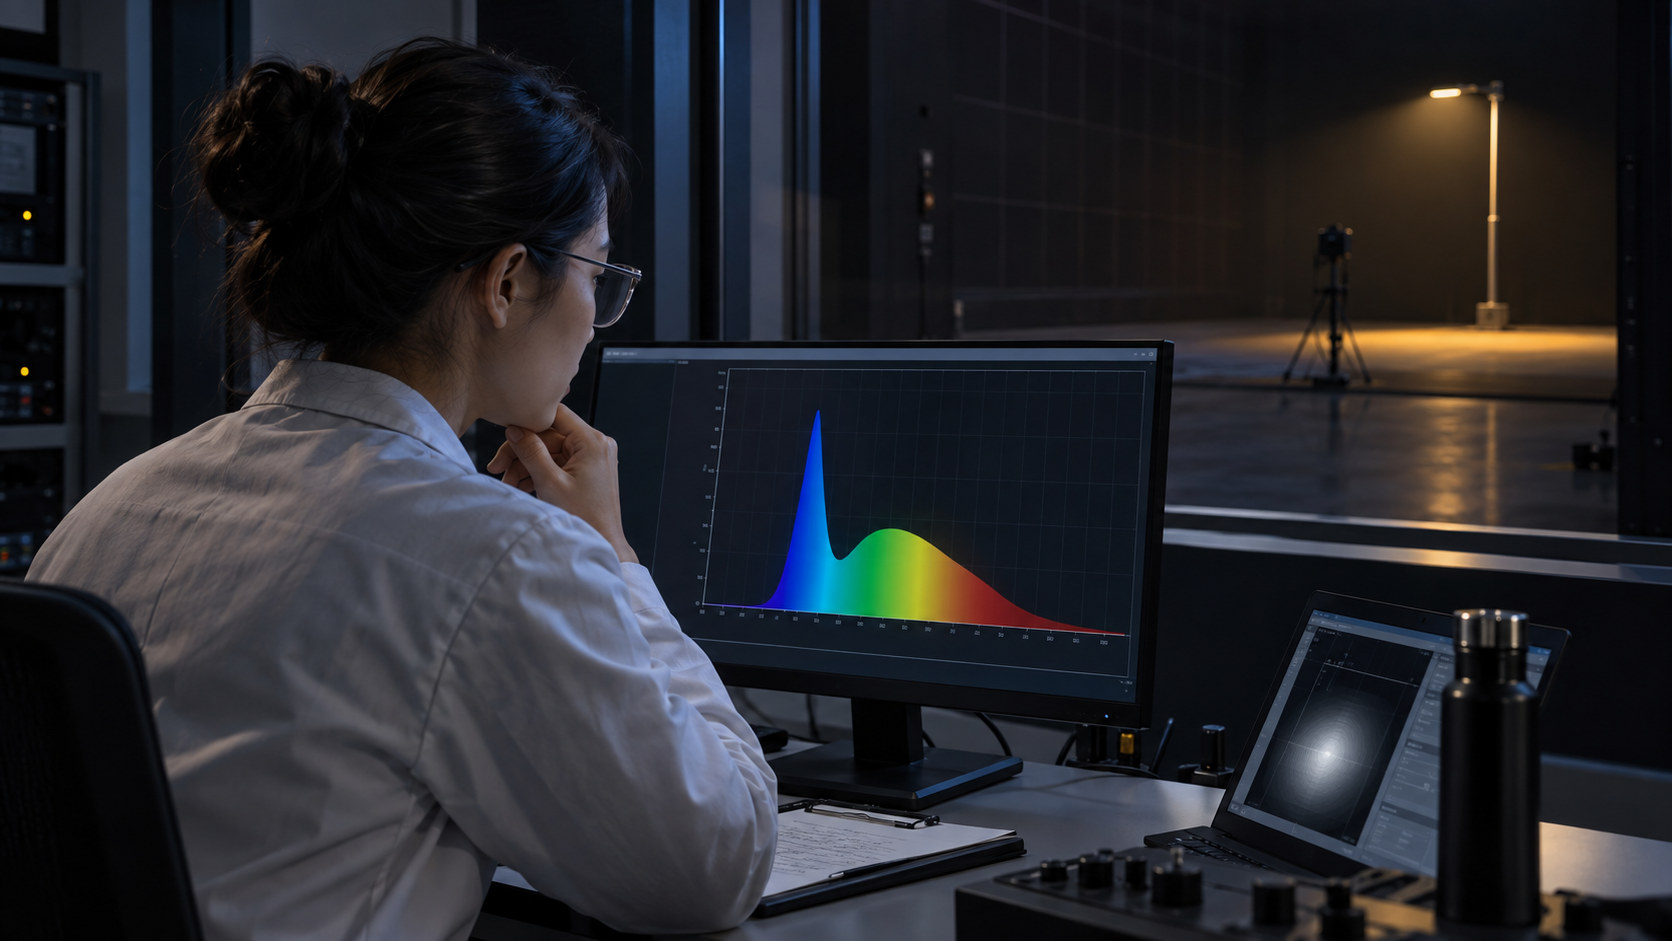




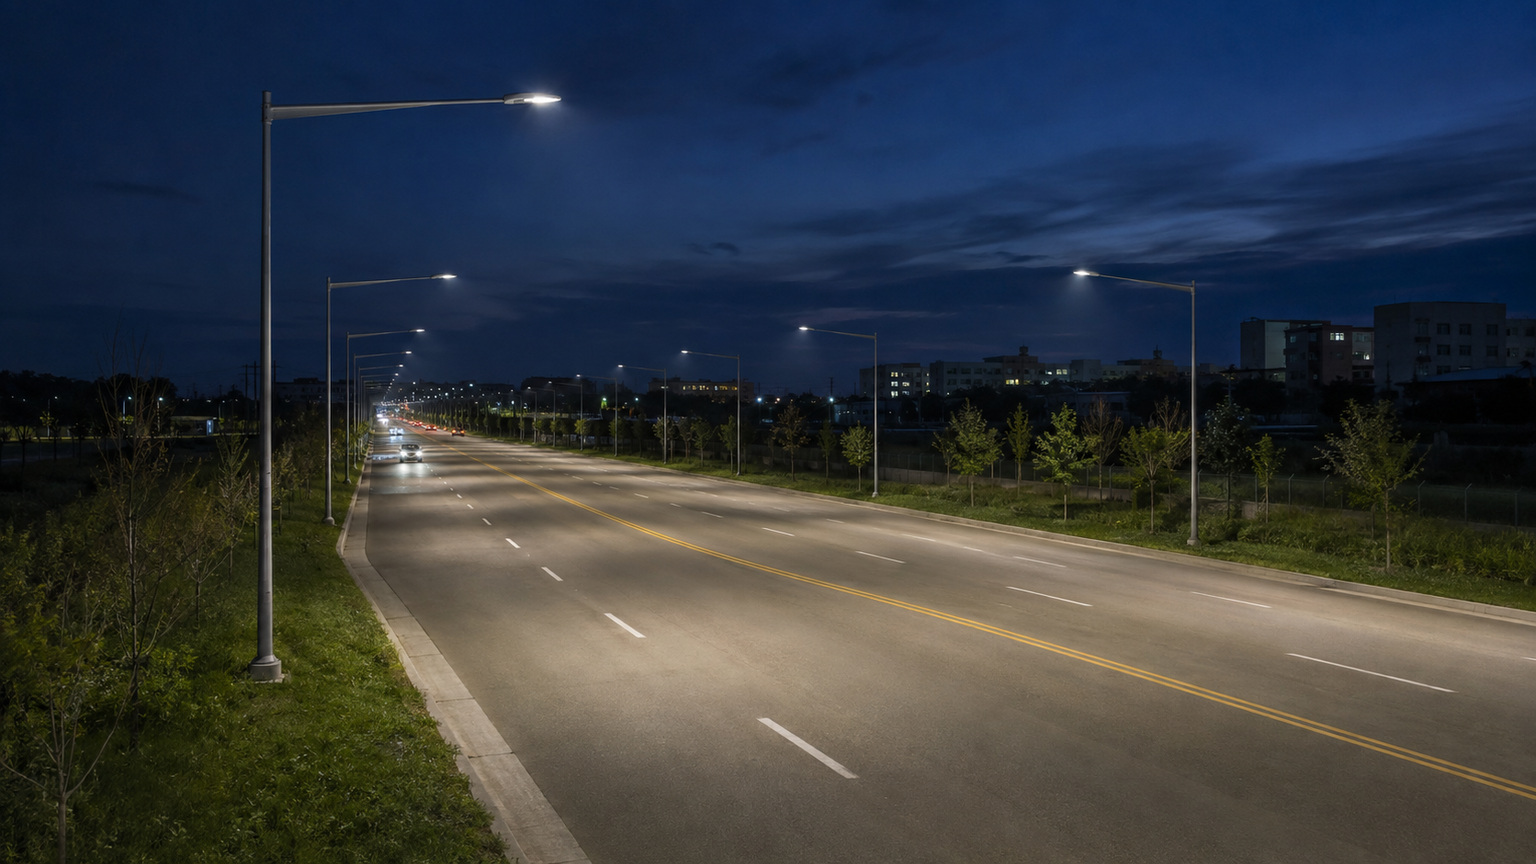
A roadway can meet an average illuminance target while still having much lower values between or beside luminaires. Roadway lighting uniformity ratios reveal that variation by comparing the average or maximum value with the minimum across a defined calculation area.
That distinction matters when cities and transportation agencies review photometric plans. An average summarizes many calculation points, but it does not show where the lowest point occurs, how low it is, or whether drivers encounter a repeated pattern of higher and lower values along the road.
Key takeaways
- Average illuminance is incomplete without the minimum, maximum, calculation grid, and applicable uniformity ratio.
- Always name the ratio’s numerator and denominator because common conventions run in opposite directions.
- Pole spacing, mounting height, luminaire distribution, layout, roadway geometry, and maintenance assumptions interact; no single spacing rule determines streetlight uniformity.
- Uniformity is one design criterion, not a substitute for reviewing glare, luminance, vertical illuminance, agency requirements, and field conditions.
What roadway lighting uniformity means
Roadway lighting uniformity describes how much calculated or measured light values vary across a defined area. A ratio closer to equality indicates a smaller spread. The exact number and the direction considered “better,” however, depend on how the ratio is written.
The Federal Highway Administration (FHWA) identifies several roadway-lighting criteria, including horizontal illuminance, vertical illuminance, luminance, and uniformity. Its archived report also notes that uniformity may compare maximum with average, average with minimum, or maximum with minimum. That is why a specification that says only “uniformity ratio” is incomplete.
Illuminance and luminance are not interchangeable
Illuminance is the light incident on a surface. For a roadway, horizontal illuminance is commonly evaluated at points on the pavement and reported in lux or footcandles. Readers who need a refresher can review the relationship among watts, lumens, and lux, while keeping in mind that lumens alone do not establish illuminance at a roadway point.
Luminance describes light leaving a surface in a viewing direction and reaching the observer. Pavement reflectance characteristics and viewing geometry therefore matter. An illuminance uniformity result cannot simply be relabeled as luminance uniformity.
“Brightness” is useful conversational language, but it is too imprecise for a calculation review. A photometric submittal should identify whether each value is illuminance or luminance, which surface or lane it covers, and which calculation method applies.
The calculation grid defines the result
A uniformity ratio is only as meaningful as the points used to calculate it. Grid boundaries, point spacing, lane coverage, edge conditions, medians, sidewalks, intersections, and other project elements can change the lowest and highest values included in the summary.
The reviewer should first locate the minimum point on the plan rather than reading only the summary table. Is it in a travel lane, at an edge, between poles, near a curve, or outside the intended calculation area? That location helps distinguish a genuine layout concern from a mismatch in grid definition.
The basis also matters. Initial values describe a new system under stated assumptions. Maintained values account for expected light loss through the maintenance factor selected for the project. Agencies may specify maintained averages, minimums, and ratios, so a comparison between an initial calculation and a maintained criterion is not valid.
How to calculate a roadway lighting uniformity ratio
Three simple values anchor the calculation:
Eavg: average illuminance across the defined gridEmin: minimum illuminance at a grid pointEmax: maximum illuminance at a grid point
The formulas are simple. Interpretation is where errors occur.
| Metric | Formula | What it shows | More uniform direction |
|---|---|---|---|
| Average-to-minimum | Eavg / Emin |
How the average compares with the lowest point | Lower, closer to 1:1 |
| Maximum-to-minimum | Emax / Emin |
Full spread between the extreme points | Lower, closer to 1:1 |
| Minimum-to-average factor | Emin / Eavg |
Reciprocal form used in some documents | Higher, closer to 1.0 |
Average-to-minimum uniformity
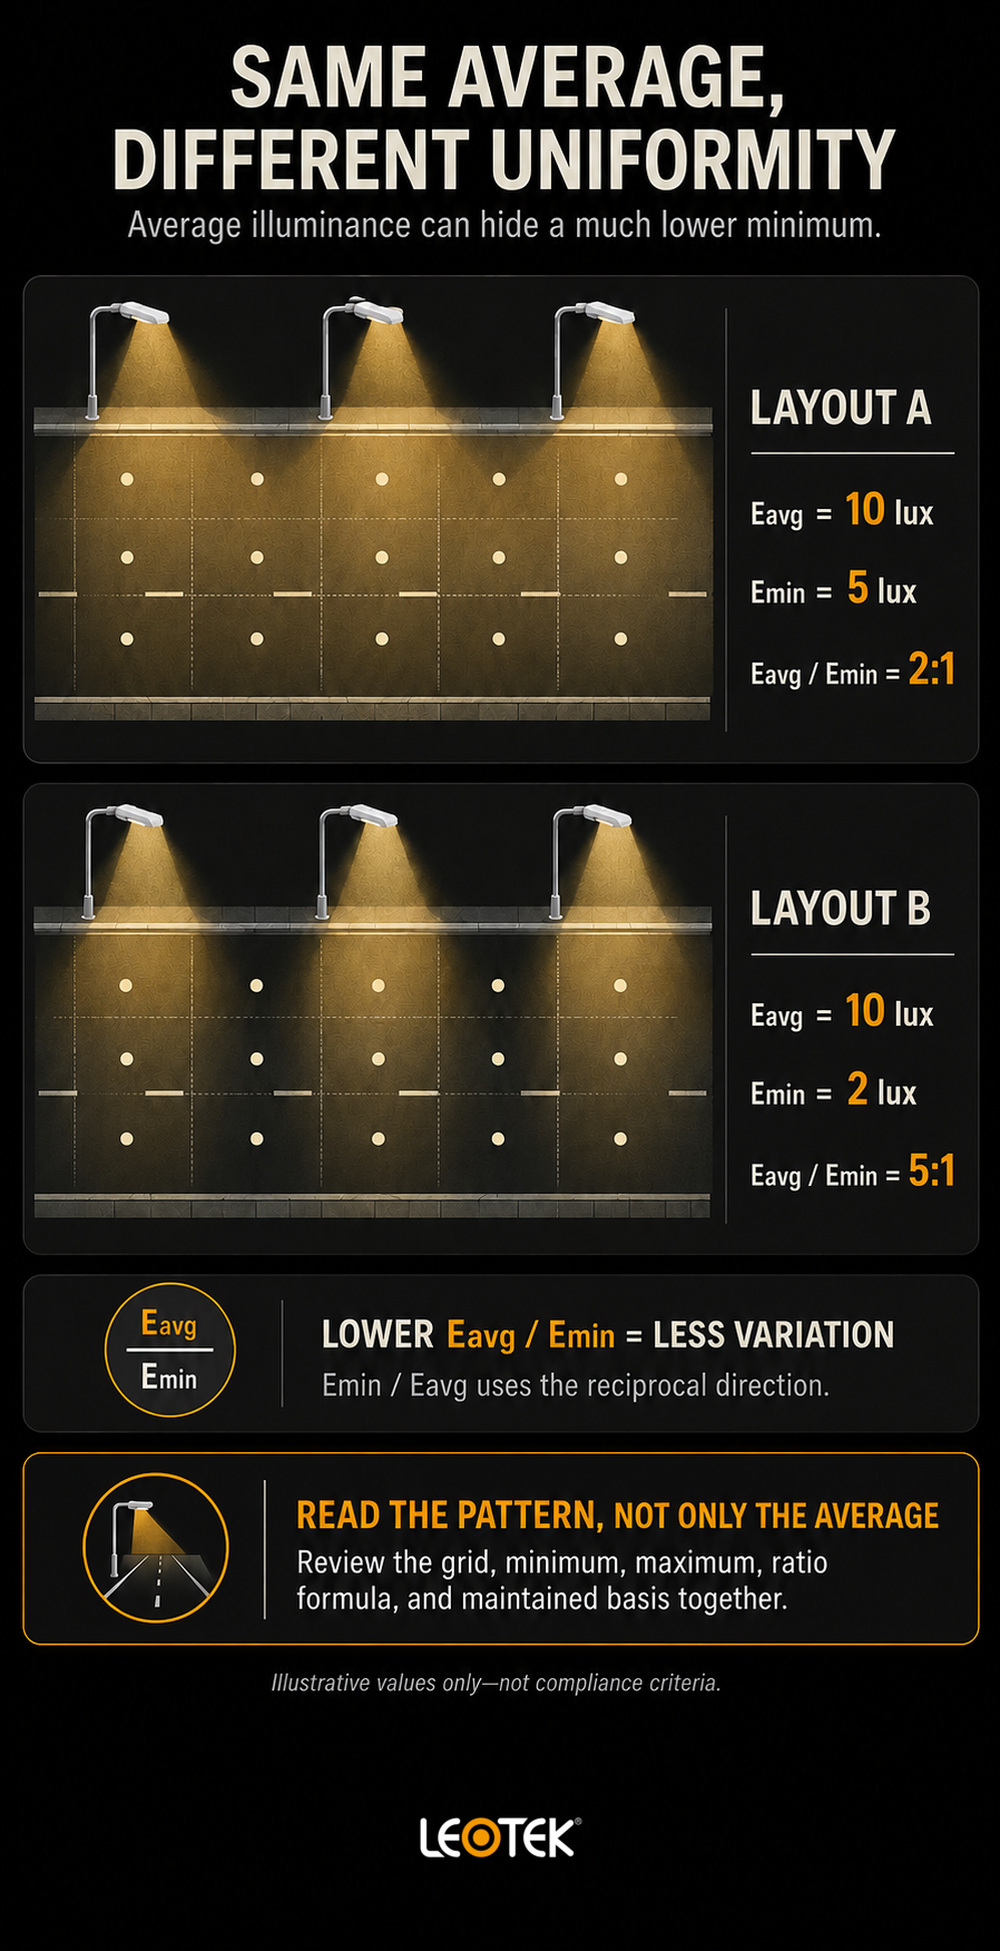
Average-to-minimum uniformity divides the average by the minimum. If the average is 10 lux and the minimum is 5 lux, the ratio is 10 / 5 = 2:1.
Under this convention, 2:1 is more uniform than 5:1 because the average is closer to the minimum. The Missouri Department of Transportation Engineering Policy Guide uses average-to-minimum illuminance in its definition of uniformity. Its numerical criteria and mounting practices apply to Missouri’s program, not to every U.S. roadway.
Maximum-to-minimum uniformity
Maximum-to-minimum uniformity divides the highest point by the lowest. It captures a wider range than average-to-minimum and can expose a strong peak near a luminaire even when the average is moderate.
The ratio does not explain why the peak or minimum exists. The point-by-point grid and project geometry must supply that context. One isolated extreme may also deserve a different review than a repeated longitudinal pattern.
Reciprocal notation can reverse the meaning
Some documents express uniformity as minimum divided by average. In that format, Emin/Eavg = 0.5 is the reciprocal of Eavg/Emin = 2:1. A higher decimal is more uniform, which is the opposite direction from an average-to-minimum ratio.
Abbreviations such as U0 or U1 do not resolve the ambiguity by themselves. Before comparing a calculation with a criterion, write out the formula, confirm whether it uses illuminance or luminance, and verify that both sides use the same convention.
Some documents also report maximum-to-average uniformity. As with every convention, identify the numerator and denominator before comparing results.
Why average light levels can hide low-light areas
An arithmetic average combines all grid values into one number. High points can offset low points, so the same average can describe very different distributions.
Consider this illustrative calculation, not a design recommendation:
- Layout A has
Eavg = 10 luxandEmin = 5 lux. Its average-to-minimum ratio is2:1. - Layout B has
Eavg = 10 luxandEmin = 2 lux. Its average-to-minimum ratio is5:1.
Both layouts report the same average, yet Layout B has a lower minimum and a larger spread. Neither result proves compliance because the governing roadway class, grid, maintenance basis, and agency criteria are not part of the example.
Read the pattern, not only the summary row
A good photometric review moves from the summary to the plan:
1. Confirm the average, minimum, maximum, and named ratios.
2. Locate the minimum and maximum points.
- Follow values along each travel lane and across the roadway.
- Look for repeated peaks and valleys associated with the pole sequence.
- Check edge areas, curves, intersections, medians, and changes in roadway width.
- Confirm that all calculations use the required maintained or initial basis.
A heat map can make patterns easier to see, but color bands should not replace numeric points. The scale can visually exaggerate or soften differences, and two maps with different scales are not directly comparable.
More average light does not automatically fix the distribution
Raising luminaire output may increase the average, minimum, and maximum together without materially changing their ratios. If a layout problem comes from geometry or optical distribution, adding output can leave the spatial pattern largely intact.
FHWA’s archived adaptive roadway-lighting research found that increasing measured average horizontal illuminance did not produce a statistically significant difference among several higher lighting-level groups in its dataset. That study does not establish a universal threshold, but it reinforces a sound review principle: evaluate lighting level and lighting quality together rather than treating a higher average as a complete answer.
What shapes streetlight uniformity
Streetlight uniformity results from interacting design inputs. A change intended to improve the minimum in one area may increase a maximum elsewhere, alter glare conditions, or affect adjacent areas. Photometric calculation is necessary to evaluate the whole layout.
Pole spacing, mounting height, setback, and arrangement
Pole spacing affects how adjacent luminaire distributions overlap. Wider spacing can reduce overlap between poles, but its effect depends on mounting height, roadway width, optics, setback, overhang, and orientation. Closer spacing may improve a minimum in one design, yet it is not a universal remedy.
Mounting height changes the footprint of the distribution and the relationship between each luminaire and the roadway. Pole arrangement also matters. One-sided, staggered, opposite, and median layouts produce different overlap patterns across lanes and along the direction of travel.
Agency practice illustrates these relationships. Missouri’s policy connects average-to-minimum criteria with specified mounting heights and directs designers to spacing computations. That is useful evidence that geometry and uniformity are linked, but it should not be converted into a national spacing-to-height rule.
Luminaire distribution and roadway geometry
Photometric distribution determines where a luminaire sends light. The familiar IES light distribution types can help describe broad application patterns, but a type label does not predict a project’s minimum or ratio. Reviewers need the current photometric file for the exact luminaire configuration and the actual model geometry.
Roadway width, number of lanes, shoulders, medians, curves, grades, intersections, pole setbacks, and mounting-arm geometry all affect where calculated values land. Tilt and orientation can shift the distribution, sometimes creating a higher peak without solving a low value at the opposite edge.
For this reason, a fixture-level statement such as “wide distribution” is not evidence that a roadway layout meets uniformity requirements. Compliance belongs to the project calculation under the governing criteria, not to a product category in isolation.
Pavement, maintenance, and field conditions
Pavement assumptions are especially important in luminance calculations because surface reflection influences what an observer sees. If the pavement classification or condition differs from the model, field luminance may differ from the predicted result.
Maintenance assumptions also influence future light levels. Apply the maintenance basis required by the governing design process rather than a generic factor copied from another project.
Actual site conditions can affect calculated or measured results. When field verification is required, follow the governing agency’s method and documentation requirements.
Uniformity is one part of nighttime roadway visibility
Uniformity helps describe the pattern across a surface, but it does not capture every visual condition. A layout with a favorable ratio can still require review for glare, vertical targets, transitions, color, spill light, and the visibility needs of the specific roadway environment.
Visual adaptation and transitions
Human vision adapts as ambient conditions change. Transitions into or out of continuously lighted sections can therefore require separate consideration, particularly before decision points or at complex interchanges.
Missouri’s engineering guide describes adaptation lighting as an attempt to reduce rapid and extreme illuminance changes at the ends of continuously lighted sections. The same guide notes that the value and implementation of transition lighting are context-dependent. This concept should not be used to claim that every variation within a normal calculation grid creates a proven adaptation hazard.
Glare and vertical illuminance require separate checks
Uniform pavement values do not prove that a luminaire is comfortable to view or that vertical objects receive the intended illumination. FHWA distinguishes horizontal illuminance, vertical illuminance, luminance, and uniformity. It also discusses vertical light reaching a driver’s viewpoint as a potential contributor to glare.
Veiling luminance and other glare criteria use their own methods. They should be reviewed directly rather than inferred from an average-to-minimum ratio. Similarly, color temperature, spectral distribution, shielding, and ecological constraints are not encoded in a uniformity calculation.
Avoid unsupported safety conclusions
Roadway lighting contributes to a broader visibility system that includes geometry, markings, signs, headlamps, traffic, speed, weather, and road-user behavior. A uniformity ratio alone cannot prove that a road is safe or that a particular product prevents crashes.
The appropriate conclusion is narrower: average, minimum, maximum, uniformity, glare, and other applicable criteria provide different information. Agencies and qualified project professionals should evaluate them under current standards and project conditions.
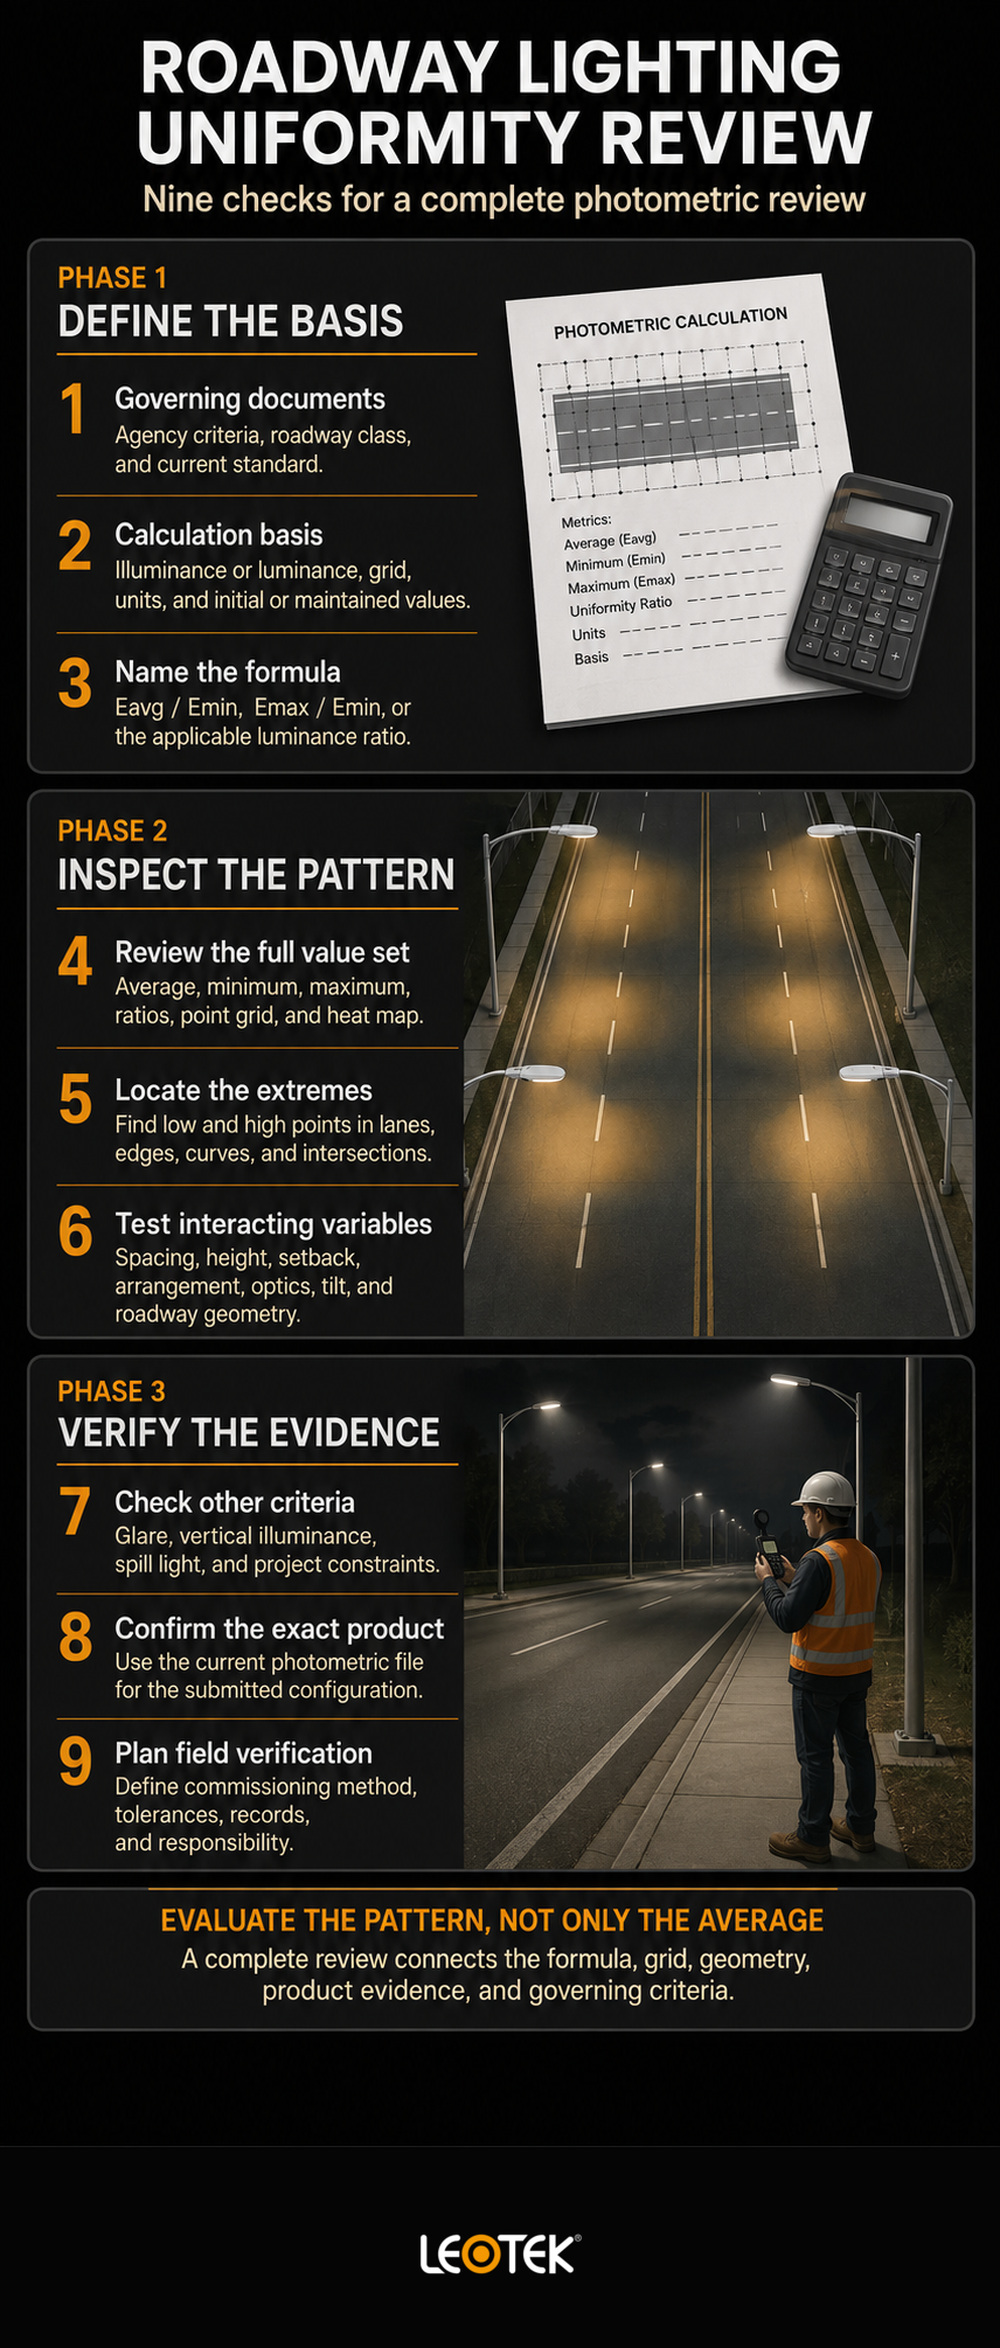
A roadway-lighting uniformity review checklist
City and transportation-agency teams can use the following sequence when reviewing a photometric package:
- Identify the governing documents. Confirm the agency criteria, current standard edition, roadway classification, pedestrian or conflict conditions, and any project-specific requirements.
- Confirm the calculation basis. Record whether the submittal evaluates illuminance or luminance, the units, calculation area, grid spacing, observer geometry where applicable, and initial or maintained values.
- Name every formula. Write
Eavg/Emin,Emax/Emin, or the applicable luminance formula instead of relying on an undefined “uniformity” label. - Review the full value set. Read average, minimum, maximum, ratios, point grid, and heat map together.
- Locate the extremes. Determine whether low and high points fall in relevant travel, edge, pedestrian, intersection, or transition areas.
- Test interacting variables. Evaluate spacing, mounting height, setbacks, arrangement, optics, tilt, orientation, pavement assumptions, and roadway geometry as a system.
- Check other criteria separately. Review glare, veiling luminance, vertical illuminance, spill light, environmental constraints, and any agency-specific requirements.
- Verify the product evidence. Use the current photometric file and documentation for the exact model and configuration. Category pages do not establish project performance.
- Plan field verification. When required, define commissioning methods, tolerances, documentation, and responsibility before installation.
Teams evaluating roadway and outdoor lighting applications should treat this checklist as a framework for asking better questions, not as a replacement for engineering design. For model-level due diligence, review current lighting technical documents alongside the project calculation and governing agency criteria.
For roadway lighting uniformity, the central procurement lesson is straightforward: evaluate the pattern, not only the average. A complete submittal identifies the minimum, average, maximum, ratio convention, grid, maintained basis, layout assumptions, photometric file, and criteria used to judge the result.
Frequently asked questions
Is a lower roadway-lighting uniformity ratio always better?
Not without defining the formula. For average-to-minimum or maximum-to-minimum ratios, a lower value closer to 1:1 means less variation. For minimum-to-average factors, a higher decimal closer to 1.0 means less variation. The applicable agency criterion still controls whether the result is acceptable.
Can two layouts have the same average illuminance but different uniformity?
Yes. High values can offset low values in the arithmetic average. If two layouts both average 10 lux but have minimums of 5 lux and 2 lux, their average-to-minimum ratios are 2:1 and 5:1, respectively. These numbers are illustrative, not compliance targets.
Does closer pole spacing always improve streetlight uniformity?
No single rule applies. Spacing changes distribution overlap, but mounting height, optics, pole arrangement, setbacks, road width, curves, tilt, and orientation also affect the result. Calculate the proposed geometry with the exact photometric file.
What uniformity ratio should a roadway meet?
Use the value specified by the governing agency and the current applicable standard for the roadway type, area, and calculation method. Do not apply a number from another jurisdiction or compare ratios written in opposite directions.
Is uniformity the same as glare control?
No. Uniformity describes variation among selected surface values. Glare and veiling luminance use separate criteria and calculations, while vertical illuminance addresses a different plane. Each applicable measure should be reviewed on its own basis.
References
- Federal Highway Administration (FHWA). “Chapter 2. Lighting and Crash Relationship,” *Design Criteria for Adaptive Roadway Lighting* (FHWA-HRT-14-051). Accessed July 17, 2026.
- Missouri Department of Transportation. “901.7 Light Source and Intensity,” *Engineering Policy Guide*. Accessed July 17, 2026.
- LEOTEK. “Watts to Lumens, Lumens to Lux: The Ultimate Guide to Understanding Lighting Performance”. Accessed July 17, 2026.
- LEOTEK. “Understanding the Five Main Types of Light Distribution by the Illuminating Engineering Society of North America (IESN)”. Accessed July 17, 2026.
- LEOTEK. “Outdoor Lighting”. Accessed July 17, 2026.
- LEOTEK. “Resources & Documents”. Accessed July 17, 2026.