


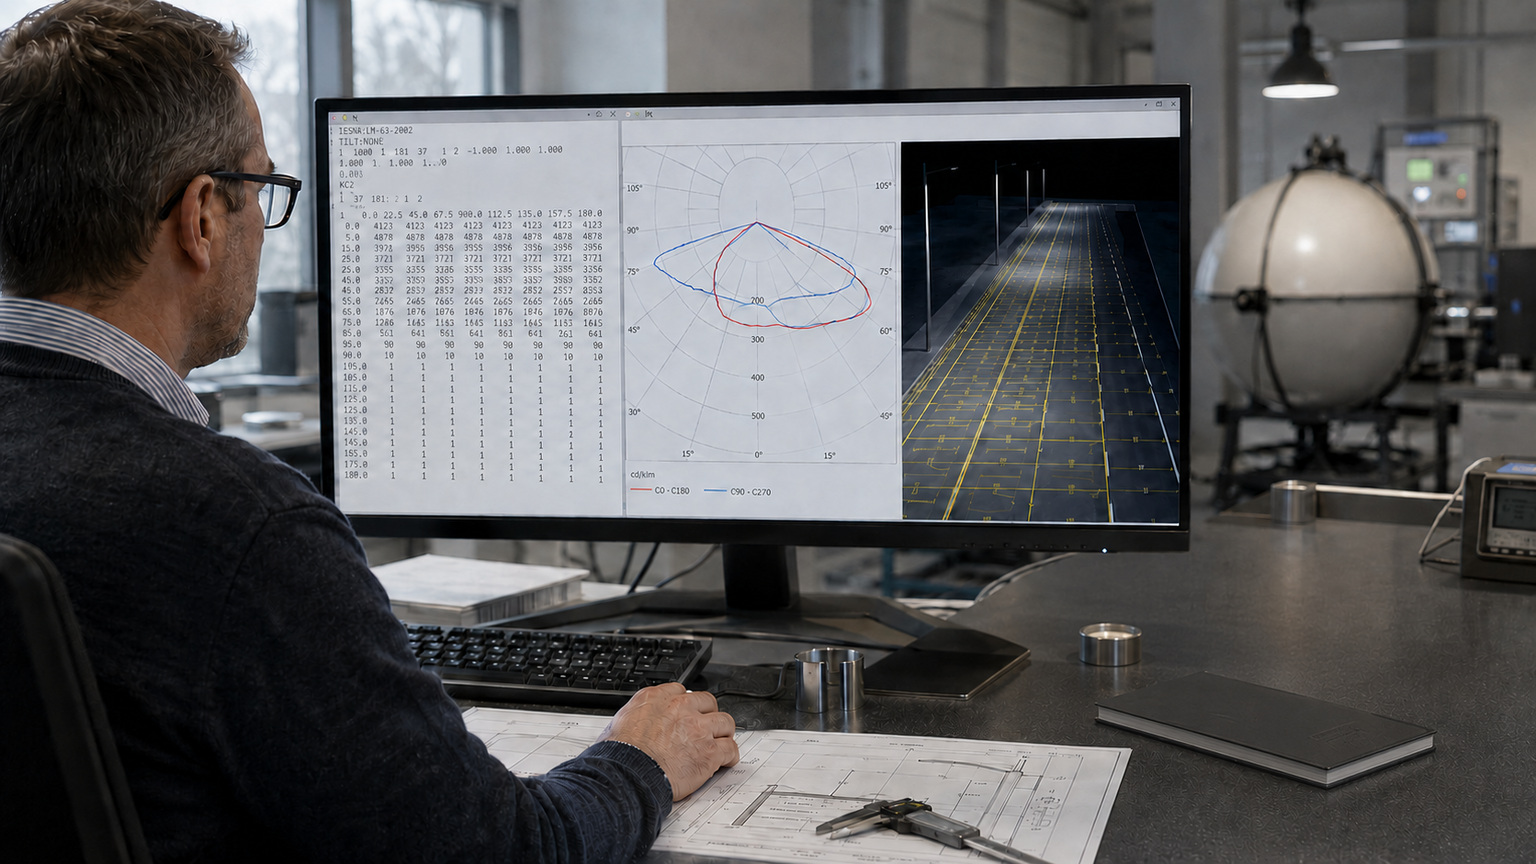
A reliable IES file interpretation starts by verifying the luminaire and test identity, decoding the vertical and horizontal angle lists, and matching each candela series to its measurement plane. After that, compare the raw data with the polar plots and the project-specific roadway model rather than accepting a rendering as the whole analysis.
Key takeaways
- An IES file contains photometric data and metadata, not a complete roadway-lighting design.
- The vertical and horizontal angle lists provide the coordinates for the candela values that follow.
- A rendering shows distribution in an accessible way, but it may not expose the file edition, multiplier, angular resolution, test identity, or model assumptions.
- Roadway suitability depends on the exact luminaire configuration and a calculation based on actual project geometry and criteria.
What an IES file does and does not tell you
An IES file is a structured text file used to exchange photometric data. It describes how a tested luminaire distributes luminous intensity in different directions. The format comes from the Illuminating Engineering Society (IES); the society currently lists ANSI/IES LM-63-19(R25), the approved method for electronic transfer of photometric data.
The central measurement is candela, the unit of luminous intensity in a particular direction. Lumens describe total luminous flux, while illuminance describes how much light reaches a surface. The distinctions among watts, lumens, lux, and candela matter because two luminaires with similar lumen output can direct that light very differently.
That is why an IES file is useful for roadway work. Calculation software can combine its angular intensity data with pole locations, mounting heights, arm geometry, luminaire orientation, road dimensions, and surface assumptions. The file supplies a critical input to the model.
It does not, by itself, describe the whole installation. It does not establish the road geometry, pole spacing, maintenance assumptions, calculation grid, or acceptance criteria. It also does not prove that a luminaire will satisfy a specification, control glare, achieve a required uniformity, or suit a given intersection or corridor. Those conclusions require a project calculation and qualified review under the applicable agency requirements.
Start with file identity and test metadata
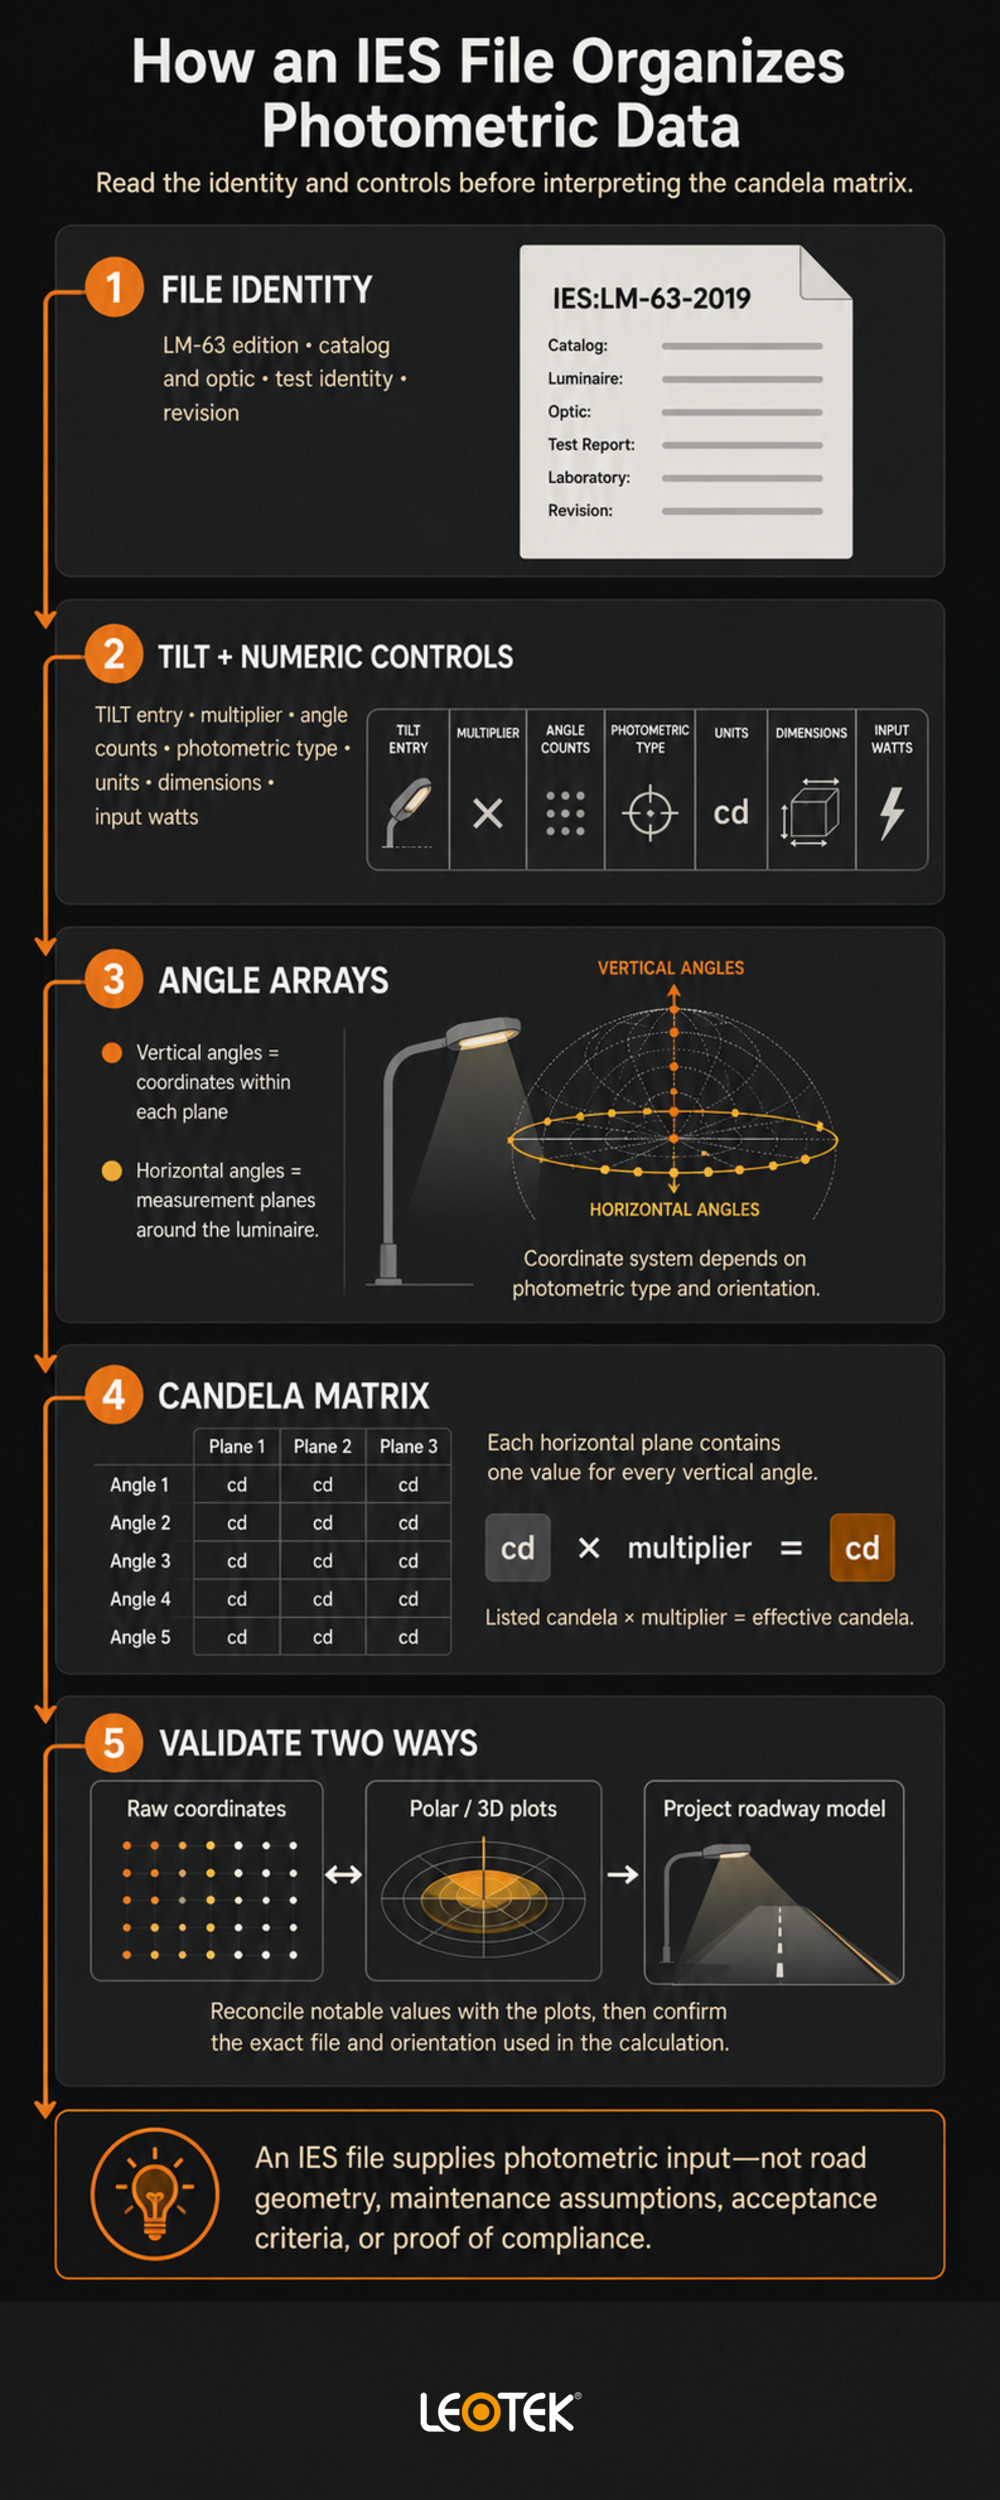
The fastest way to misuse good photometric data is to apply it to the wrong configuration. Before examining the distribution shape, establish what the file represents.
Check the declared LM-63 edition
Open the file in a text editor and inspect its first line. A file created under the 2019 edition begins with IES:LM-63-2019, according to the American National Standards Institute overview of LM-63-19. Earlier files may declare earlier LM-63 editions.
Do not assume that every usable photometric file follows the same edition. Field conventions changed over time, and legacy files remain in circulation. The edition identifier tells the reviewer which specification to consult when a field is unclear.
The IES Computer Committee develops standard formats for data used by lighting calculation software and lists LM-63 among its documents. That committee scope does not guarantee that any individual file matches the product under review.
Match the exact luminaire configuration
Read the descriptive keywords above the numeric data. Depending on the edition and how the file was prepared, these fields may identify the manufacturer, catalog number, test number, test laboratory, issue date, luminaire description, or other details.
Compare what is present with the submittal or current manufacturer documentation. At minimum, the review should resolve these questions:
- Does the catalog or model identity match?
- Does the optical distribution or optic code match?
- Does the light-output package or operating condition match?
- Does the input wattage align with the submitted configuration?
- Does the mounting orientation used in the model match the tested orientation?
- Is the photometric file current for the product revision being evaluated?
A missing field is not automatically evidence that the photometry is invalid, especially in an older file. A conflict, however, is a reason to stop and request clarification before using the data for a procurement or design decision.
Read the TILT entry before the numbers
The TILT line separates the descriptive portion from the main numeric section. TILT=NONE means the file does not apply tilt-factor data through that field. TILT=INCLUDE introduces additional tilt geometry, angles, and multiplying factors that must be read before the main photometric block, as shown in the public LM-63-2002 file structure.
Do not confuse this data field with the aiming or tilt assigned to a luminaire in a roadway model. They are related to different parts of the workflow. If TILT=INCLUDE appears, use the instructions for the file’s declared LM-63 edition rather than improvising a calculation.
Decode the numeric controls and angle arrays
After the TILT information, the file moves into a compact series of values that tells software how to interpret the remaining data. The public LM-63-2002 structure documented by Lighting Analysts shows the general sequence: source-related fields, a candela multiplier, angle counts, photometric and units types, luminous dimensions, factors, input watts, angle arrays, and candela values.
That reference describes the 2002 edition. Treat it as a structural guide, not a substitute for the edition declared in the file.
Read the control fields as a set
| Field | What to check |
|---|---|
| Lamp or source fields | Determine how the source and luminous flux are represented under that edition. Confirm how the edition distinguishes absolute and relative photometry rather than inferring it from legacy lamp terminology. |
| Candela multiplier | Apply this factor to the listed intensity values. A multiplier other than 1 can materially change every candela value. |
| Number of vertical angles | This should match the length of the vertical-angle array and the number of candela values in each horizontal series. |
| Number of horizontal angles | This determines how many complete candela series should follow. |
| Photometric type | Type A, B, or C defines the measurement coordinate system. Do not interpret the angle arrays until this field is understood. |
| Units type | This identifies the dimensional unit convention used for the luminous opening dimensions. |
| Width, length, and height | These describe luminous dimensions for photometric purposes, not necessarily the full external dimensions of the housing. |
| Edition-dependent factors | The meaning and treatment of legacy ballast or later-generation fields depend on the declared LM-63 edition. |
| Input watts | Compare the recorded value with the exact submitted operating configuration, allowing only differences that can be explained and documented. |
These controls are easy to skip because a viewer usually parses them automatically. Yet they often reveal a configuration mismatch before anyone spends time evaluating the rendered pattern.
Use vertical angles as the first coordinate axis
The vertical-angle array lists the angular positions at which intensity values were recorded. Each horizontal measurement plane uses this same ordered list of vertical coordinates.
Inspect the starting angle, ending angle, and increments. The relevant range and resolution depend on the photometric type, distribution, and intended analysis. A coarse or unusual sequence is not automatically wrong, but it should be understood before the file is accepted.
Avoid relying on a memorized rule such as “0 degrees always means this direction” without first confirming the coordinate system and luminaire orientation. The file’s photometric type and edition-specific conventions govern the interpretation.
Use horizontal angles to identify measurement planes
The horizontal-angle array identifies the planes around the luminaire. Each listed horizontal angle is followed later by a complete series of candela values corresponding to all listed vertical angles.
The number and range of horizontal planes also convey information about symmetry. A symmetric distribution may be represented with fewer measured planes than a fully asymmetric one. Do not infer symmetry from the count alone; check the photometric type, angular coverage, metadata, and applicable file convention.
For roadway luminaires, orientation is especially important because the street side, house side, and directions along the roadway are not interchangeable. A plausible-looking plot can still be rotated incorrectly in a project model.
Read the candela matrix one plane at a time
The candela block looks like a long wall of numbers, but its organizing rule is straightforward:
1. Take the first listed horizontal angle.
- Read one candela value for every vertical angle, in the order shown in the vertical-angle array.
- Move to the second horizontal angle and read another complete vertical series.
- Continue until every horizontal plane has a complete series.
- Apply the candela multiplier as required.
If a file declares 5 vertical angles and 3 horizontal angles, the candela block should contain 3 groups of 5 values. That is a structural illustration, not a product test. The first group maps to horizontal plane 1, the second to plane 2, and the third to plane 3.
Build a coordinate worksheet when the pattern is unclear
A small table can make a difficult file auditable:
| Horizontal angle | Vertical angle | Listed candela | Multiplier | Effective candela |
|---|---|---|---|---|
| Plane 1 | Angle 1 | File value | File factor | Value × factor |
| Plane 1 | Angle 2 | File value | File factor | Value × factor |
| Plane 2 | Angle 1 | File value | File factor | Value × factor |
This worksheet makes it easier to locate the peak direction, observe how intensity changes as the vertical angle increases, and compare one horizontal plane with another. It also helps a reviewer confirm that the number of values agrees with the declared array sizes.
Peak candela is not a score for luminaire quality. A high value means the intensity is concentrated in a particular direction. Whether that concentration helps a roadway design depends on mounting height, spacing, setback, road width, aiming, and the rest of the distribution.
Treat anomalies as review triggers
Pause and investigate when you find:
- a model or optical code that conflicts with the submittal;
- an unexpected candela multiplier;
- angle counts that do not match the arrays or candela groups;
- angular coverage that does not fit the stated photometric type or expected orientation;
- input watts or source data that conflict with the submitted configuration;
- abrupt intensity changes that cannot be reconciled with the plots; or
- a test date that predates a known optical or electrical revision.
These conditions do not prove that a file is defective. They identify questions that should be resolved with the manufacturer, test documentation, or qualified lighting professional before the file becomes the basis of an agency decision.
Compare raw data, plots, and the project rendering
Raw data and graphics answer different questions. A strong review uses both.
What the polar plot shows well
A polar candela plot turns selected measurement planes into curves. It helps the reader see where intensity is concentrated, how broad or narrow the distribution appears, and whether selected planes differ. A 3D photometric surface can make asymmetry and orientation easier to recognize; these are among the views described by an IES photometric-file viewer.
Those views are useful summaries, and a separate guide to IES light distribution types can help readers understand Type I through Type V terminology. Distribution type, however, is not a replacement for reading the exact file or modeling the roadway geometry.
What a rendering may leave out
A roadway rendering may combine the IES file with scene geometry, materials, camera position, exposure, calculation settings, and software display choices. The result can help stakeholders understand the design, but the image alone may not reveal:
- which exact photometric file was loaded;
- whether the luminaire was rotated or tilted correctly;
- the candela multiplier and angular resolution;
- the pole height, setback, arm length, or spacing;
- pavement or other surface assumptions;
- calculation points and contour thresholds;
- maintenance or light-loss assumptions; or
- the numeric results used for agency review.
This does not make the rendering inaccurate. It means the rendering reflects more than the IES data, and its appearance depends on assumptions that need separate verification.
Use a two-way validation method
Start with the file, identify several notable candela coordinates, and see whether their directions make sense in the polar and 3D plots. Then move the other way: begin with a visible feature in the plot, such as a strong lateral lobe, and locate the angle and intensity values that create it.
Finally, confirm that the roadway calculation uses the same file and intended orientation. Review the numerical calculation results against the project’s applicable criteria. A polished perspective view should support that review, not replace it.
Apply IES file interpretation to roadway review
For a city or transportation agency, this review is best treated as an input-control procedure. The goal is not to calculate an entire corridor by hand. It is to ensure that the model begins with the right photometric evidence.
Before modeling, confirm the exact luminaire, optical distribution, output package, operating condition, mounting orientation, and file revision. Then define the roadway inputs that sit outside the IES file: road and pedestrian geometry, mounting height, arm length, setback, spacing, tilt, surface properties, calculation grid, maintenance assumptions, and applicable agency criteria.
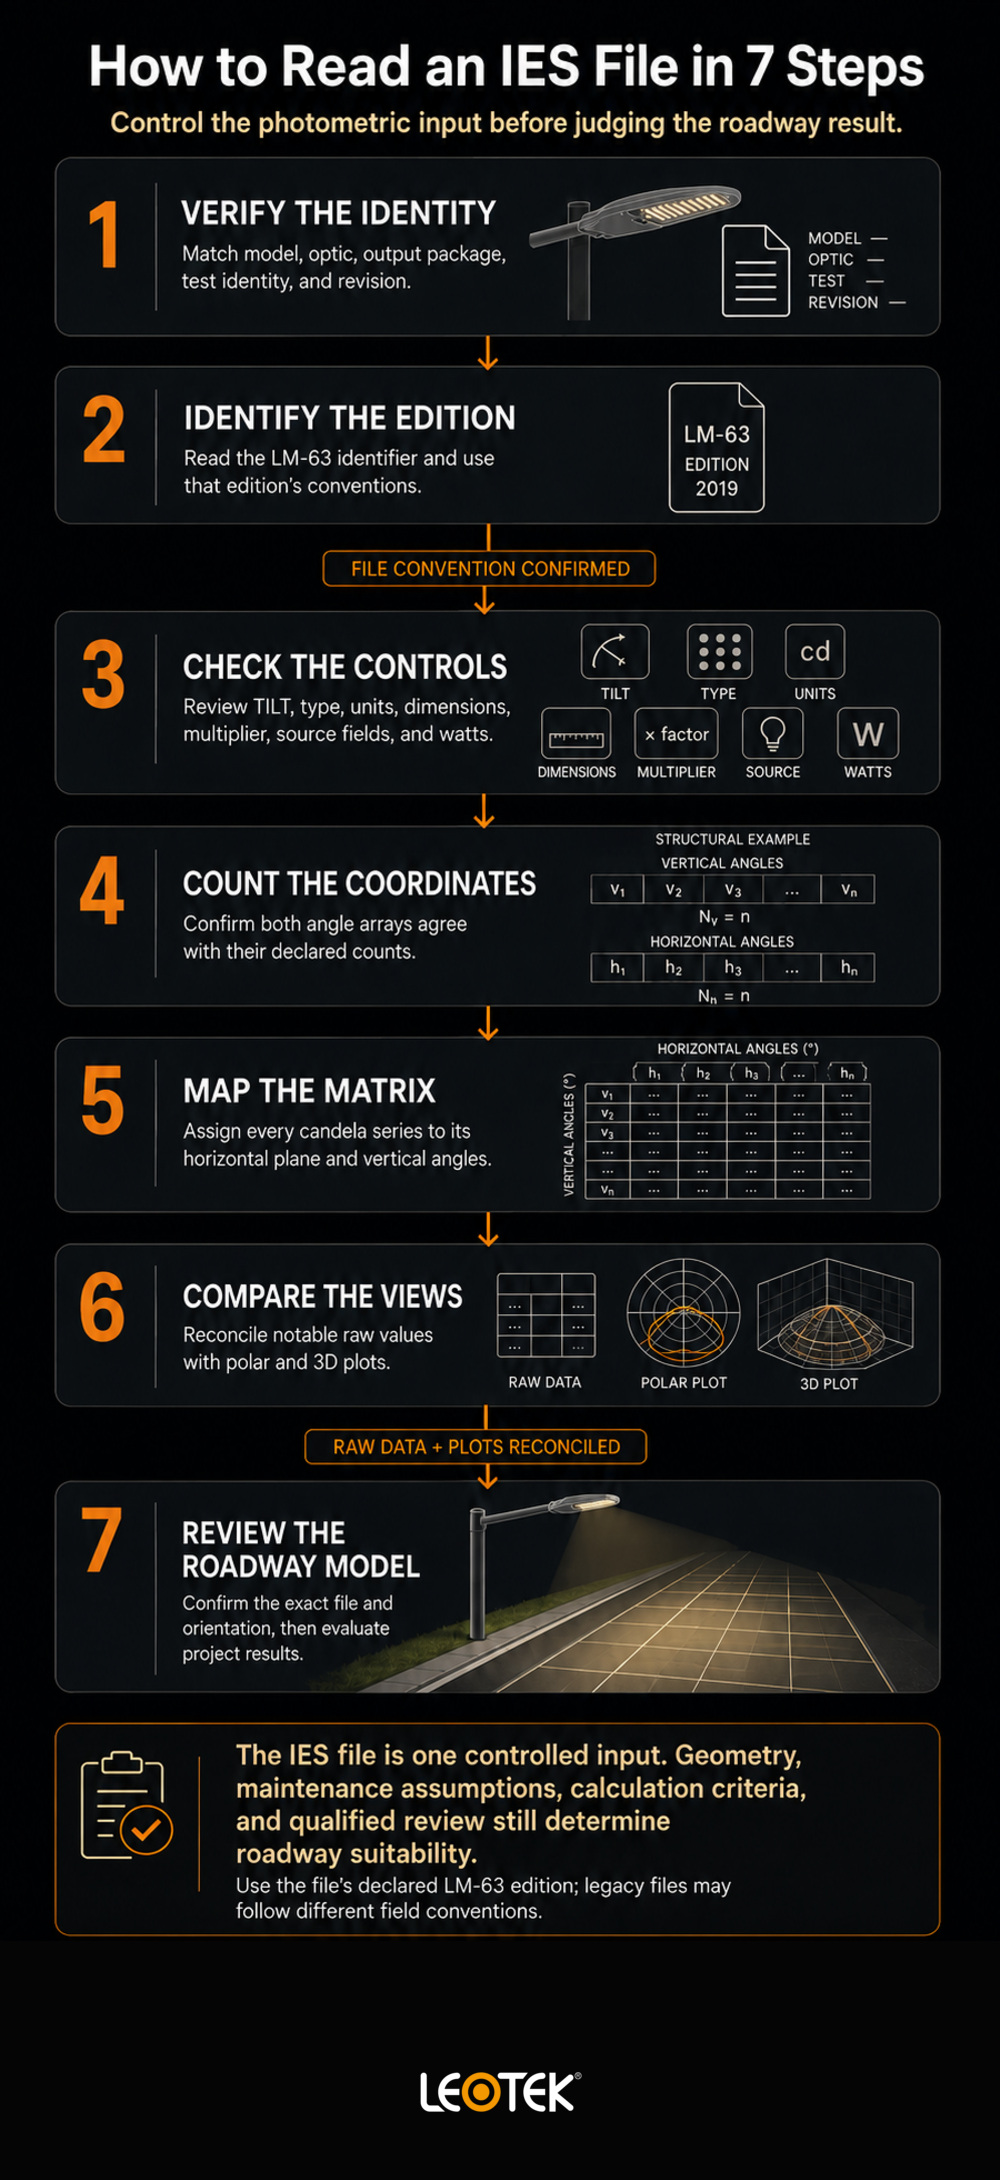
How to read an IES file in 7 steps
- Verify the identity. Match the filename and metadata to the submitted model, optic, output package, and revision.
- Identify the edition. Read the LM-63 identifier and use the conventions for that edition.
- Check the controls. Review
TILT, photometric type, units, dimensions, multiplier, source fields, and watts. - Count the coordinates. Confirm the vertical and horizontal angle arrays agree with their declared counts.
- Map the matrix. Assign each candela series to its horizontal plane and each value to its vertical angle.
- Compare the views. Reconcile notable raw values with the polar plot and 3D distribution.
- Review the roadway model. Confirm the exact file and orientation, then evaluate numeric results under the applicable project criteria.
For technical validation, use the LEOTEK technical documents and IES files hub to look for the relevant roadway-luminaire file. Confirm the model, optic, output package, test date, and revision before importing it. The resource hub is a navigation point; the individual document and its relationship to the submitted product still require verification.
Reliable IES file interpretation combines three checks: verify the exact file, reconcile its raw values with the plots, and judge roadway suitability through the project calculation. No single rendering or file-level value replaces that complete review.
Frequently asked questions
Can I read an IES file in a text editor?
Yes. An IES file is structured text, so a text editor can display its metadata, control fields, angles, and candela values. Correct interpretation depends on the declared LM-63 edition and its field conventions.
What is the difference between lumens and candela in an IES file?
Lumens describe total luminous flux. Candela describes luminous intensity in a particular direction. An IES file’s angular candela data explains where the light goes, which is why lumen output alone cannot define roadway coverage.
What does TILT=NONE mean?
It means the file does not apply tilt-factor data through the LM-63 TILT field. It does not mean the luminaire cannot be aimed or assigned a mounting tilt in calculation software.
Does a high peak candela mean a better roadway luminaire?
No. Peak candela describes intensity in one direction. It does not establish coverage, uniformity, glare control, or suitability for a particular road geometry.
Does an IES file prove compliance with roadway-lighting requirements?
No. The file provides photometric input. Project geometry, modeling assumptions, calculation results, applicable criteria, and qualified review determine whether a design meets the relevant requirements.
Why inspect the raw file when software can render it?
The raw file exposes information that a rendering may not show, including test identity, LM-63 edition, multiplier, angular resolution, orientation clues, input watts, and exact candela values. Checking both helps catch mismatches before they affect the roadway analysis.
References
- Illuminating Engineering Society (IES). *ANSI/IES LM-63-19(R25), Approved Method: IES Standard File Format for the Electronic Transfer of Photometric Data and Related Information*. Accessed July 26, 2026.
- Kelechava, Brad. “IES Standard File Format for Photometric Data, IES LM-63-19”. ANSI Blog, updated June 5, 2025. Accessed July 26, 2026.
- Illuminating Engineering Society (IES). “Computer Committee”. Accessed July 26, 2026.
- Lighting Analysts, Inc. “IESNA LM-63 Format”. AGi32 Photometric Toolbox Documentation. Accessed July 26, 2026.
- Innerscene. “Free Online IES & LDT Viewer (No Signup)”. Accessed July 26, 2026.
- LEOTEK. “Watts to Lumens, Lumens to Lux: The Ultimate Guide to Understanding Lighting Performance”. Accessed July 26, 2026.
- LEOTEK. “Understanding the Five Main Types of Light Distribution by the Illuminating Engineering Society of North America”. Accessed July 26, 2026.
- LEOTEK. “Resources & Documents”. Accessed July 26, 2026.