





“Should the replacement streetlights be 2200 K, 3000 K or 4000 K?” sounds like a purchasing question. It becomes a design question as soon as the street includes a school crossing, residential windows or a habitat boundary. A warmer appearance does not, by itself, describe how much useful light reaches a pedestrian. A cooler appearance does not establish that the proposed layout works.
A useful comparison keeps three things separate: what the source emits, where the luminaire sends it, and what the observer must see. The FHWA research discussed below gives a concrete reason to make that separation. Its results are informative, but a chart comparing complete lighting systems cannot settle every question about color temperature.
Read the detection-distance chart with its experiment
How the detection distance was recorded
In the driver experiment, participants called out when they recognized the 45-inch (1.14-m) child-sized mannequin. An experimenter marked the response, and differential GPS located the vehicle relative to the target. Figure 5 shows that sequence. The study also used cylindrical tubes as catch trials: recognizing the intended target mattered more than reporting any distant silhouette.
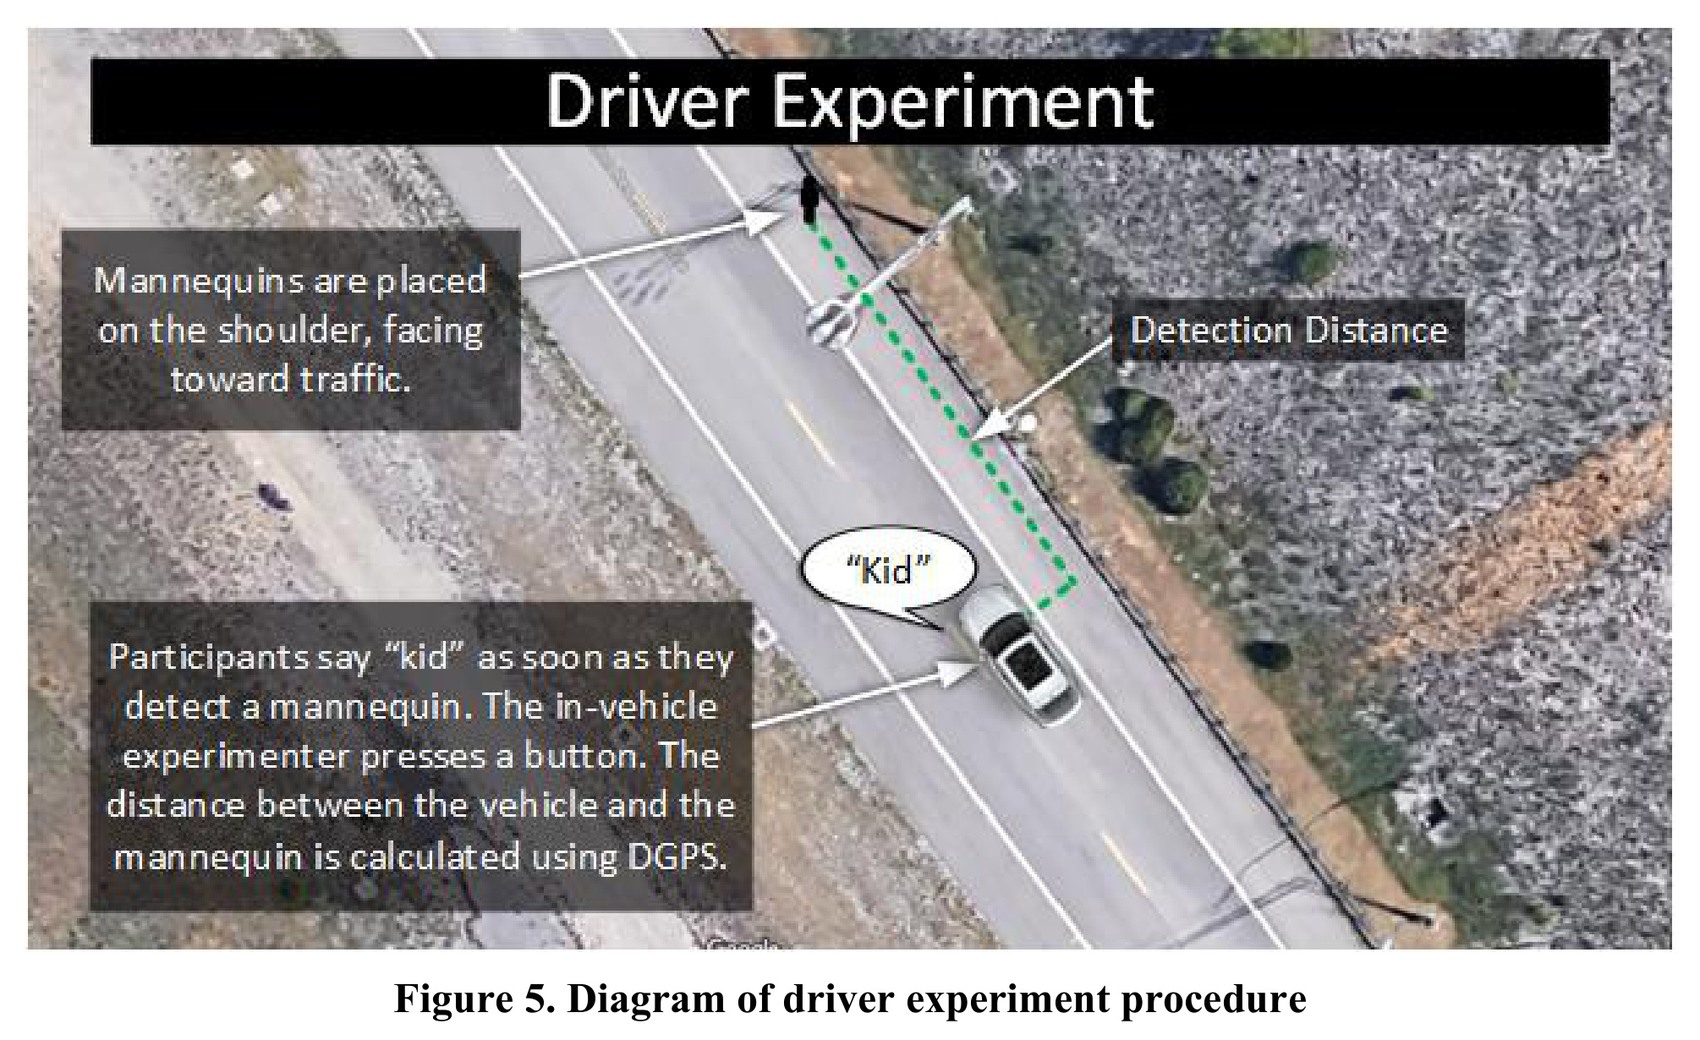
Read the detection-distance result as the outcome of that task and setting. It is useful evidence for a visibility discussion; a project crash-reduction estimate requires different evidence.
The target and the catch trial. Figure 6 shows the mannequin beside the cylindrical tube. The photograph makes the task concrete: a participant had to distinguish the intended target from a different silhouette. The 45-inch height describes the experimental mannequin, not a child participant or an installation dimension.
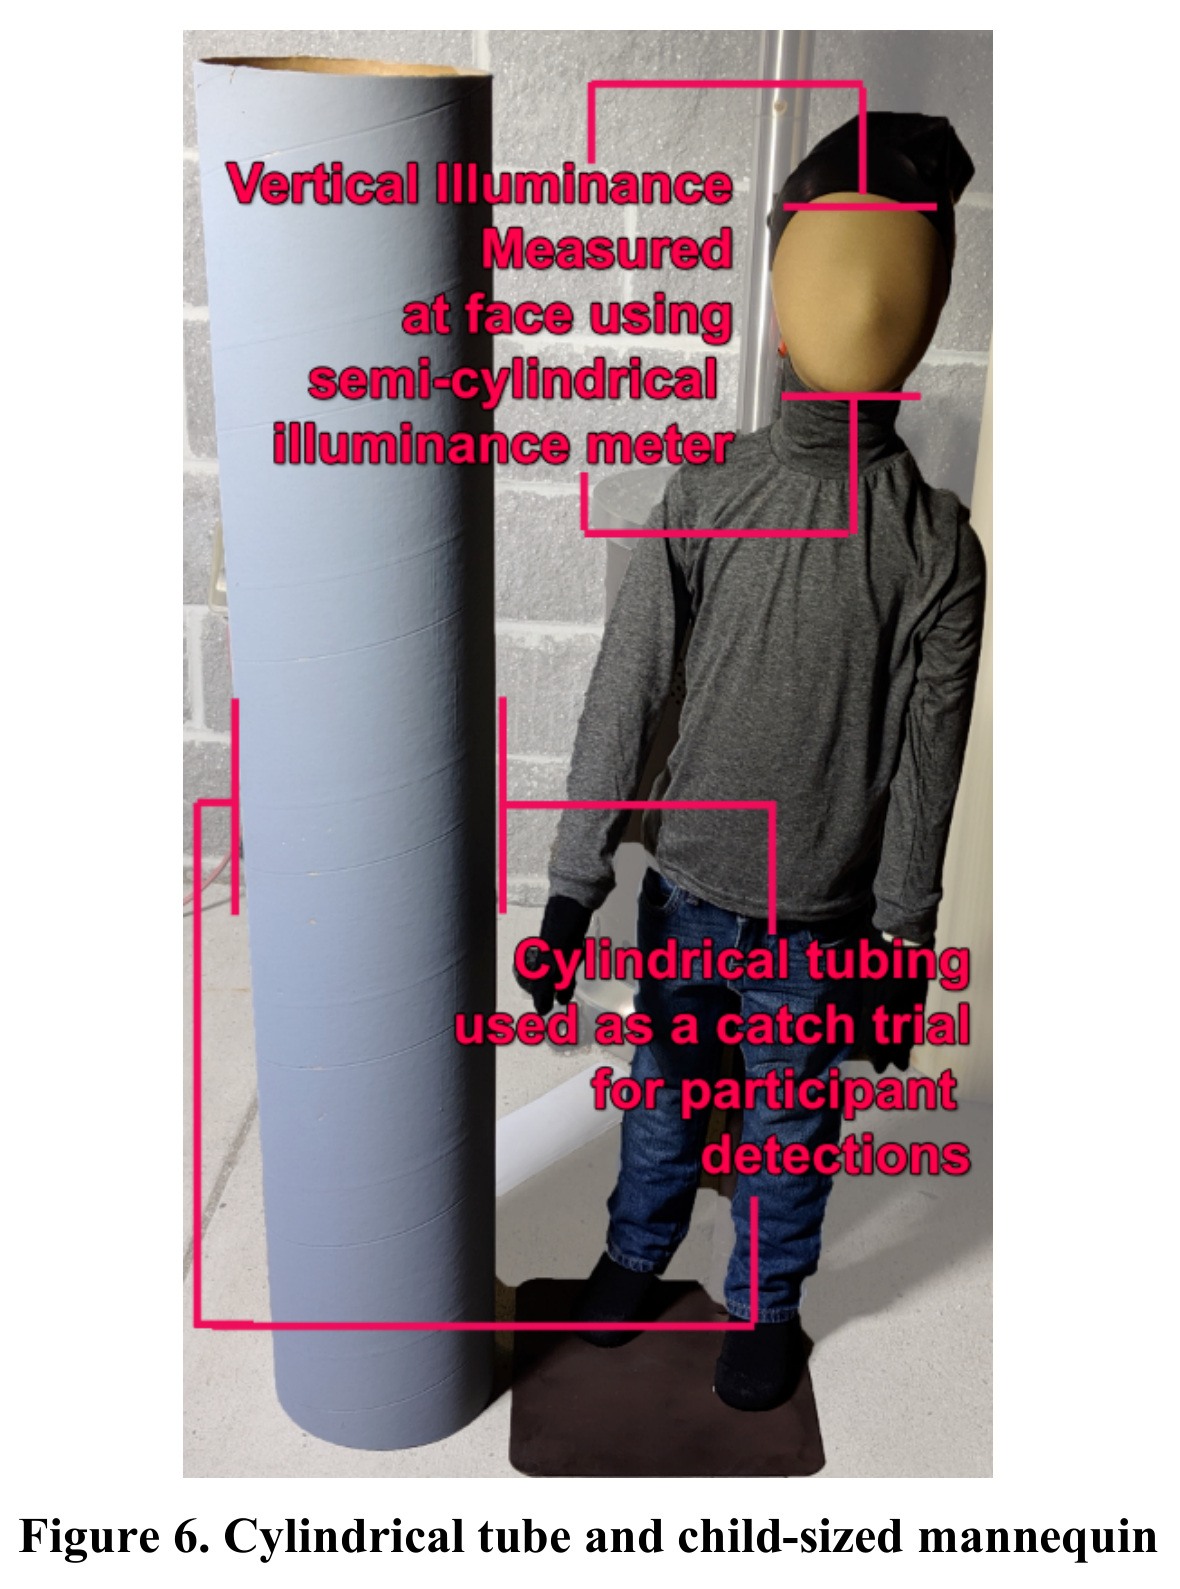
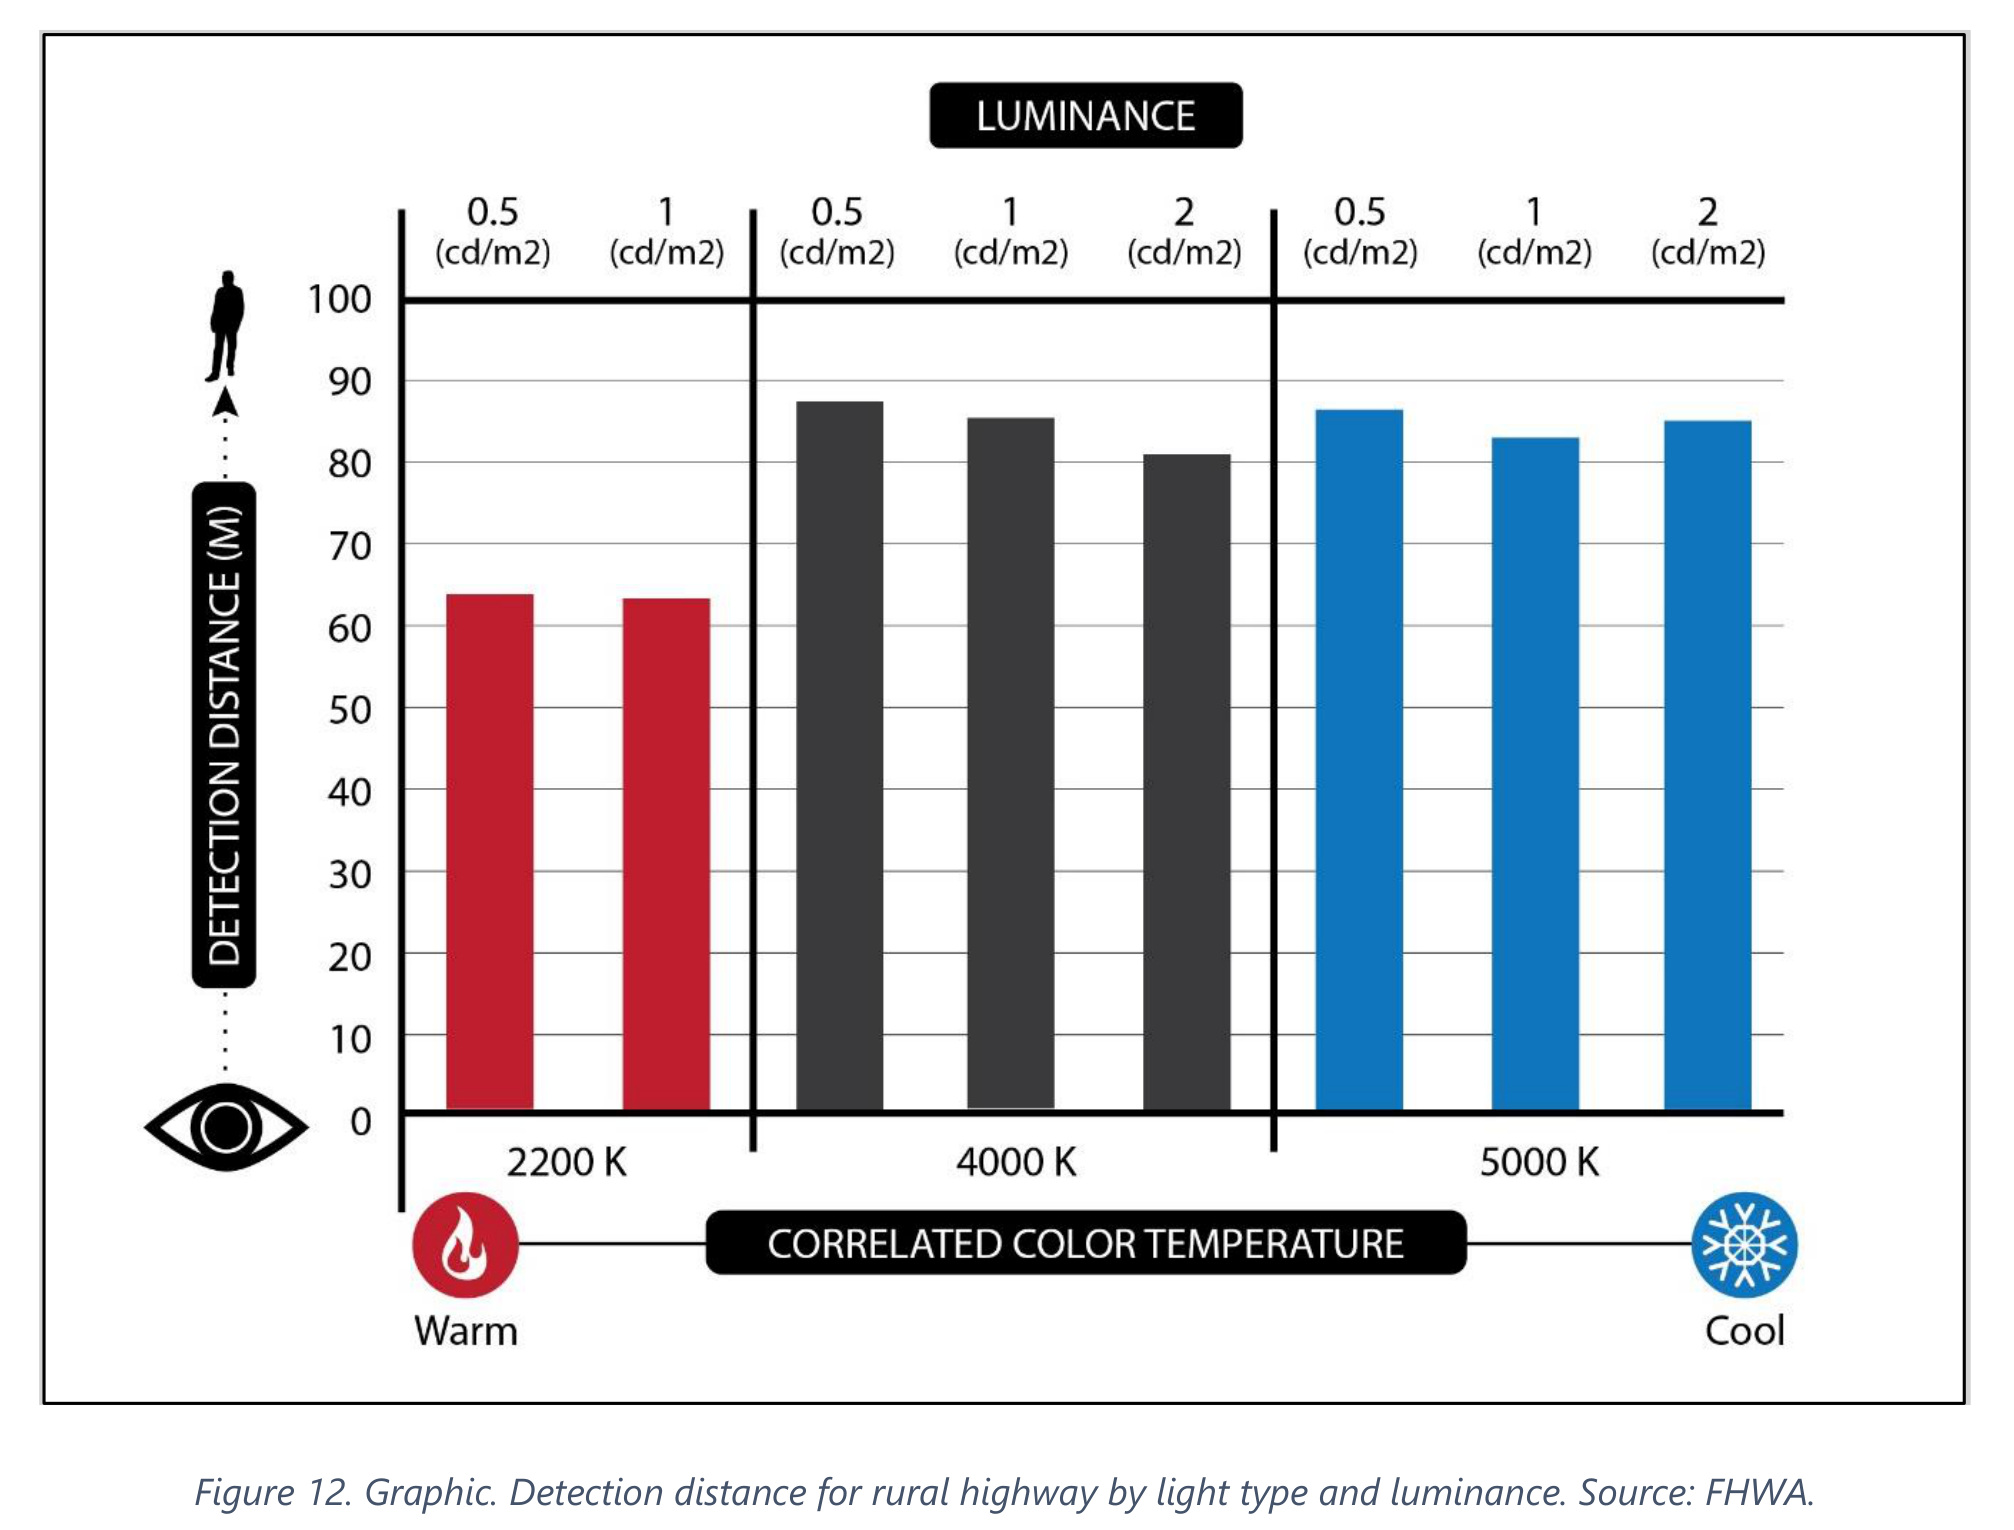
Figure 12 in FHWA’s Pedestrian Lighting Primer summarizes a rural-road experiment using 2200 K, 4000 K and 5000 K LED systems. The underlying 2020 research report used adult drivers identifying child-sized mannequins. It reports shorter detection distances for the tested 2200 K system and expressly identifies light distribution as a possible contributor. This is a comparison of the tested systems, not proof that CCT alone caused the difference.
The report describes a learning effect across repeated driving trials. Its conclusions emphasize early observations before familiarity changed detection. The outcome is detection distance in that experiment, not a measured crash reduction or a performance rating for a LEOTEK luminaire. Those boundaries belong beside the figure, where someone considering a specification can see them.
Read the plotted comparisons before doing arithmetic with them. Identify the light system and luminance level associated with each bar, and check which combinations the source actually presents. Do not fill a missing combination by interpolation or turn a visually estimated bar height into an exact specification. A useful discussion asks whether the proposed project resembles the tested visual task and which differences could change the result. If a reviewer wants to claim a precise percentage improvement, return to the original analysis and its uncertainty rather than calculating a promotional percentage from the summary illustration.
CCT is a useful description with limited reach
Color temperature is useful for communicating the apparent warmth or coolness of white light. It compresses a more complicated spectrum into a familiar number. The 2023 FHWA Lighting Handbook explains why the complete spectral power distribution matters when evaluating spectral effects. Different sources can share a nominal CCT while distributing their radiant energy differently across wavelengths.
Look behind the Kelvin label
Figure 19 shows the same research target under the 2200 K, 4000 K and 5000 K sources used in the experiment. It gives a view of the test arrangement, but camera exposure and light distribution affect the photograph. Its appearance is not a controlled ranking of CCT or a LEOTEK product comparison.
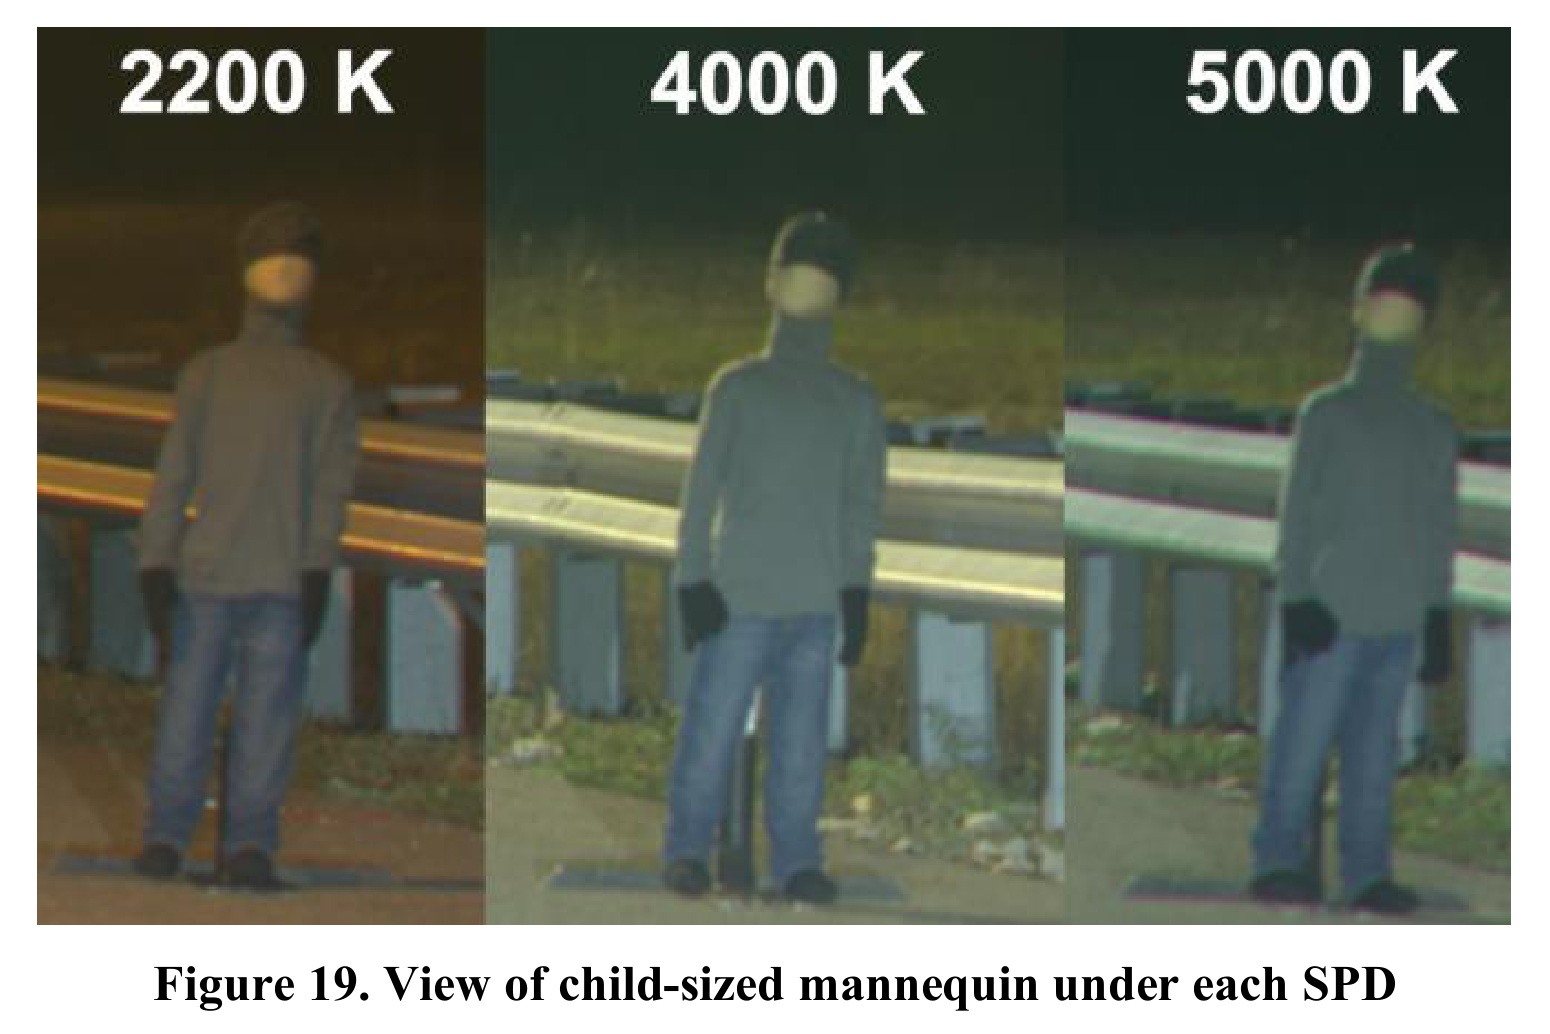
Figure 20 plots the spectra of the three research luminaires, normalized to 6.27 lux. The curves show the wavelength content hidden behind the Kelvin labels. Normalizing the curves to an illuminance value helps frame the spectral comparison; it does not establish equal electrical input or luminaire efficacy.
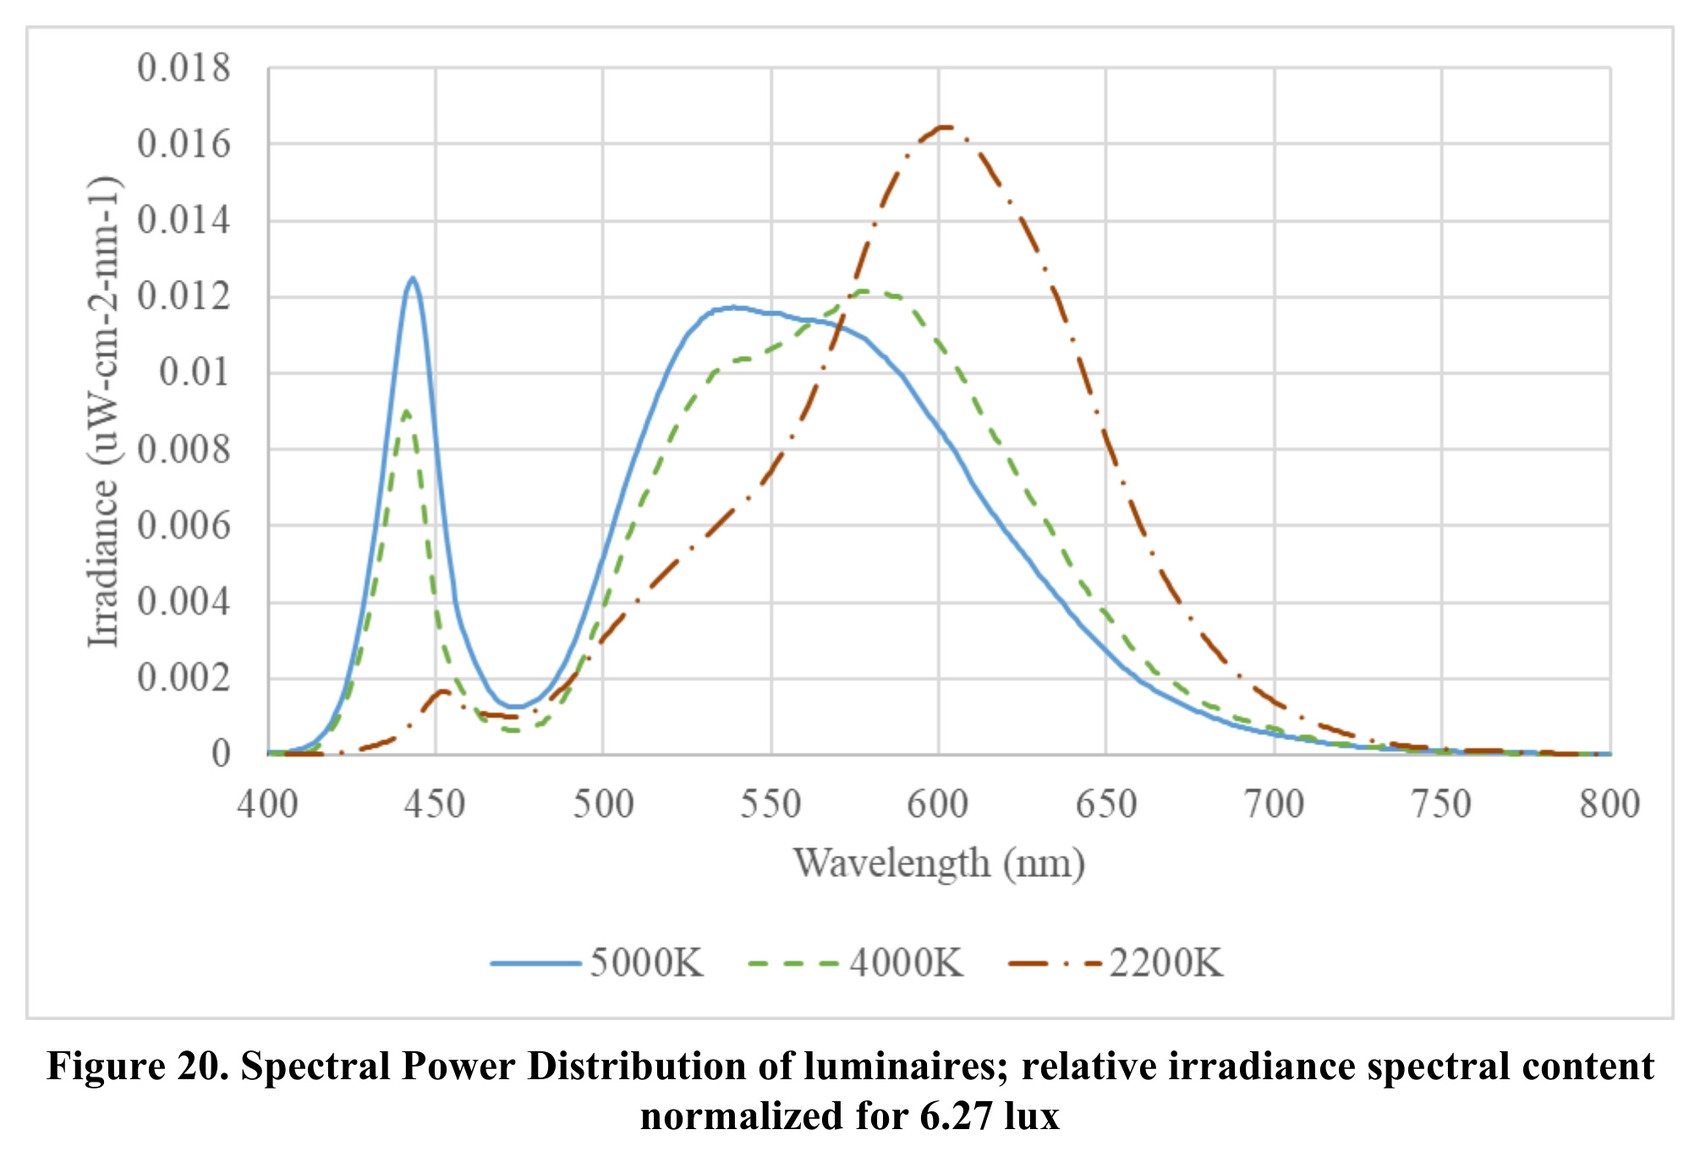
For a proposed substitution, obtain the actual configuration’s spectrum where the project needs it. The report’s research-source curves cannot stand in for a LEOTEK product spectrum. Read the photograph, spectrum and detection results together with the experimental method rather than treating any one image as a purchasing verdict.
That distinction changes the submittal request. If the question concerns ecological exposure, obtain the proposed configuration’s spectral data and the applicable site assessment. If the question concerns driver visibility, review target illumination, background and viewing direction. A CCT label belongs in both discussions, but it cannot replace either one.
A project team can start by writing down the decision it is actually making. “Choose a comfortable appearance for this residential block” differs from “meet an agency’s crossing-visibility criteria while limiting exposure at this habitat edge.” Combining those questions into a single preferred Kelvin number makes it harder to see which requirement a candidate has satisfied.
A bright roadway and a visible person are different checks
Imagine two proposals that produce a similar average roadway luminance. One directs useful light toward the approaching face of a person near the crossing. The other sends more of its output beyond that location or toward the pavement behind it. A comparable road average does not establish comparable target illumination or contrast.
This is a hypothetical review example, not a new experiment. Its purpose is to identify the information missing from a CCT-only comparison: the receiving plane, the target position and the observer’s view. Ask the designer to show those relationships in the calculation and explain where field observations are needed.
Keep the units visible. Road luminance in cd/m² and illuminance in lux describe different quantities. Within illuminance, a horizontal reading is not interchangeable with a vertical or semi-cylindrical reading. A table headed simply “light level” can conceal that difference. Our pedestrian-lighting design example follows the measurement areas through a published calculation.
Compare proposals without hiding changes in the optics
A project review should identify the exact catalog configuration behind each submitted photometric file. Record output setting, distribution, mounting height, orientation, shielding and the proposed control schedule. If several of those inputs change between options, label the comparison as a system comparison. Do not describe it as a controlled color-temperature comparison.
For an illustrative bid review, suppose one option uses a different optic to address a crossing while another retains the original distribution. Both may be legitimate proposals. The useful question is which geometry, photometry and operating assumptions produce the result. Requiring a one-page change log can make that difference visible without asking reviewers to reconstruct it from dozens of files.
The comparison should also identify the source of each number. A value may be a supplier’s published rating, a modeled result, a field observation or a project criterion. These are different kinds of evidence. Keeping them in separate columns prevents a calculated average from acquiring the appearance of a measured acceptance result.
Use a decision record that follows the task
| Question | Evidence to retain | Review implication |
|---|---|---|
| Driver detects a person | Target position, background, receiving plane, distribution and actual photometry | Ask what was held constant before attributing a difference to CCT. |
| Pedestrian sees a route or obstruction | Walking route, transitions, obstructions and the defined visual task | Do not reuse a driver-detection result as a trip-hazard acceptance result. |
| Neighbor or driver reports glare | Source location in the view, orientation, optics and operating setting | Test a geometric or optical correction as well as an output change. |
| Habitat boundary limits exposure | Actual spectrum, species/site assessment, direction and operating hours | A warm-color label alone does not establish ecological suitability. |
| Procurement reviews a substitute | Configuration, photometric file, spectral evidence where required and changed inputs | Record what must be recalculated or verified. |
This table is an editorial review aid, not an FHWA standard or a product-certification checklist. It helps assign the next question to the person who can answer it. The lighting designer, agency, ecological specialist and operations team may contribute different evidence to the same decision.
Keep glare in the observer’s view
A warmer-looking source can still be prominent in the line of sight. Review the approaching driver’s view, pedestrian routes, nearby windows and any relevant security-camera view. A calculation that reports satisfactory values on selected surfaces does not automatically describe the discomfort or visibility problem that prompted a complaint.
The practical review is specific: identify the source, observer position and task affected. Then compare the proposed correction. Aiming, shielding, distribution or placement may deserve attention before changing the whole system’s output or spectrum. The security-lighting guide explains that process using separate diagrams for measurement, contrast and spill.
Photographs can document the location and the observer’s direction, but their exposure settings change apparent brightness. Use a consistent documentation method for comparisons and retain the relevant equipment settings. A compelling before-and-after image is useful communication; it is not, on its own, a measurement of disability glare.
Give ecological requirements their own evidence
A site near habitat may have constraints that differ from those of a commercial corridor. The review should identify the species or habitat concern, the direction and timing of exposure, and the responsible project’s acceptance criteria. Obtain the actual spectrum and proposed distribution rather than treating a warm-color description as a universal ecological approval.
For example, a hypothetical site might have a useful daytime access route, a nighttime operating requirement and a sensitive boundary on one side. Document which hours need lighting and where light is permitted to go. A spectral choice, shield and operating schedule answer different parts of that problem; none should disappear from the review because another looks favorable.
The final record should connect the accepted conditions to the ordered configuration. If an alternative source or optic is proposed later, identify what needs reassessment. The ECOridge technology overview provides product-context questions; the project’s ecological and lighting reviews establish suitability.
Make the pilot answer a purchasing question
Before installing a trial, state what result would change the purchasing decision. Possible questions include whether the proposed arrangement addresses a difficult crossing view, whether shielding resolves a boundary issue, or whether the scheduled output still serves the documented task. Avoid a pilot whose only recorded outcome is that the lamps switched on.
Identify representative observation locations and the operating settings to be checked. Separate commissioning defects from a design limitation: an incorrectly aimed luminaire needs a different response from a correctly installed configuration that leaves a task unresolved. Retain the accepted model, installation record and observations together so the next reviewer can follow that distinction.
A trial may reveal constraints that the initial information missed. Record tree cover, adjacent commercial lighting, changed traffic conditions and weather during the observation. These notes do not require inventing a universal test method; they make the scope of the actual check intelligible. The agreed project method determines which measurements and repeat observations are necessary.
Write the specification so a substitution remains reviewable
A specification that names only wattage and CCT leaves too much of the visual task unstated. Retain the applicable criteria, photometric configuration, mounting assumptions, spectral requirements where relevant, supported controls and documentation needed for acceptance. The responsible agency’s requirements determine the final wording.
When a substitute arrives, compare the evidence against that record. The same nominal Kelvin value is not a substitute for matching the accepted distribution and configuration. Conversely, a different catalog name does not explain whether the proposed alternative meets the required task. Ask the supplier to identify the change and provide the material needed for the design review.
The most useful conclusion is therefore conditional and specific: this documented configuration was accepted for this project under these assumptions. That statement gives maintenance a basis for the next replacement. A generic claim that one CCT is always best gives the team far less to work with.
Frequently asked questions
Does the FHWA chart prove that 4000 K is always better than 2200 K?
No. It reports the outcome of the tested systems and task. The original authors identify distribution as a possible contributor. Keep those conditions with the result instead of turning it into a universal product ranking.
Can CCT replace a spectral power distribution review?
No. CCT describes apparent color in a compact form. Where spectral content matters to a project, request the proposed source’s spectral data and the relevant assessment rather than inferring it from the nominal Kelvin value.
Does warmer light automatically solve glare?
No. Review the visible source, distribution, orientation and observer’s task. A spectral choice does not establish the result of those geometric and optical checks.
What should accompany a color-temperature substitution?
The actual configuration, matching photometry, spectral evidence where required, changed inputs and the designer’s review against the accepted criteria. Record which parts of the prior acceptance remain applicable and which need verification.
Sources and evidence boundaries
- FHWA, Research Report: Street Lighting for Pedestrian Safety, FHWA-SA-20-062, December 2020: driver experiment, results, conclusion and Appendix B. Research findings, not universal design requirements.
- FHWA, Pedestrian Lighting Primer, FHWA-SA-21-087, April 2022: discussion preceding Figure 12 and the original summary chart.
- FHWA Lighting Handbook, February 2023: CCT, spectrum and visual-performance context. Consult the responsible agency’s applicable current criteria for a project.
Cover: reused AI-generated editorial illustration for LEOTEK; not a verified installation or test record. The technical chart is an original FHWA source figure, with its research context identified separately.