



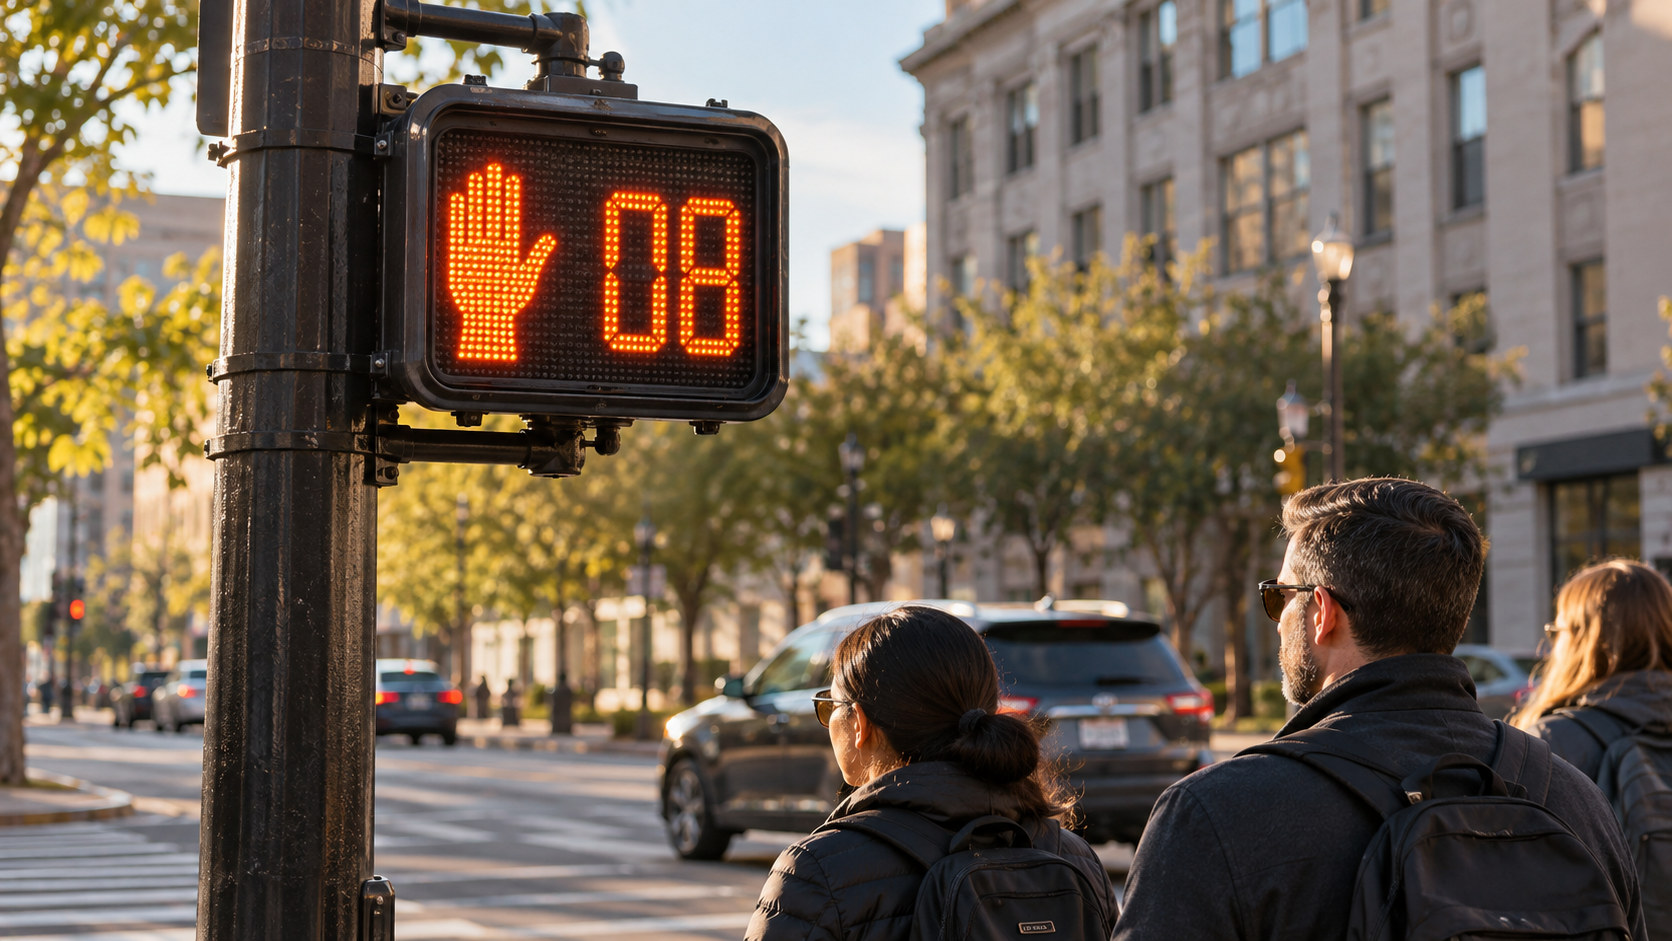
The countdown is the number of seconds left in the pedestrian change interval. It is not an invitation to begin crossing, a timer for the whole signal cycle, or a setting that determines the crossing time.
MUTCD Section 4I.04 requires a countdown display when the pedestrian change interval is more than seven seconds. For intervals of seven seconds or less, it permits a countdown. The threshold concerns the change interval, not the total time from WALK to the next vehicle movement. (MUTCD pedestrian control provisions)
Check the display against the sequence
During WALK, the walking-person indication is displayed and the countdown is not used. During the pedestrian change interval, the countdown operates with the flashing upraised hand. It shows time remaining in that interval. After displaying zero, the digits must remain dark until the next countdown begins. Section 4I.04 also prohibits countdown use during the specified red-clearance interval of a concurrent vehicular phase. (MUTCD pedestrian control provisions)
Those details matter during commissioning. A display can appear to count normally while starting at the wrong point or continuing into an interval where it does not belong. Check the displayed sequence against the controller's approved timing, including transitions the agency requires the installation to handle.
The manual separately advises care when controller timing changes because some countdown logic resides in an independent timing device. It also advises that a countdown interrupted or shortened by a preemption transition should discontinue and go dark immediately. These are Guidance provisions; they should not be presented as identical in status to the section's mandatory Standard provisions. (MUTCD pedestrian control provisions)
| Condition | Display | Provision | Paragraph |
|---|---|---|---|
| Pedestrian change interval >7 seconds | Countdown required | Standard | 4I.04.01 |
| Pedestrian change interval <=7 seconds | Countdown permitted | Option | 4I.04.02 |
| WALK interval | Countdown not used | Standard | 4I.04.06 |
| Flashing upraised hand | Countdown displayed simultaneously; counts remaining change-interval seconds | Standard | 4I.04.03, .05-.06 |
| After zero | Countdown remains dark until next countdown begins | Standard | 4I.04.05 |
| Specified concurrent-vehicle red-clearance interval | Countdown not used | Standard | 4I.04.06 |
| Pedestrian entry >100 feet from countdown | Numbers at least 9 inches high recommended | Guidance | 4I.04.08 |
| Change interval interrupted or shortened for preemption transition | Countdown should discontinue and go dark immediately | Guidance | 4I.04.10 |
A source-based operational summary. Standard, Option and Guidance are retained as distinct provision types.
Source: MUTCD Sections 4I.04.01-10, PDF pages 760-761 / printed pages 719-720. Original source 1
Not a controller timing plan or installation instruction. Change interval is not the total pedestrian clearance time. Apply the project's governing documents.
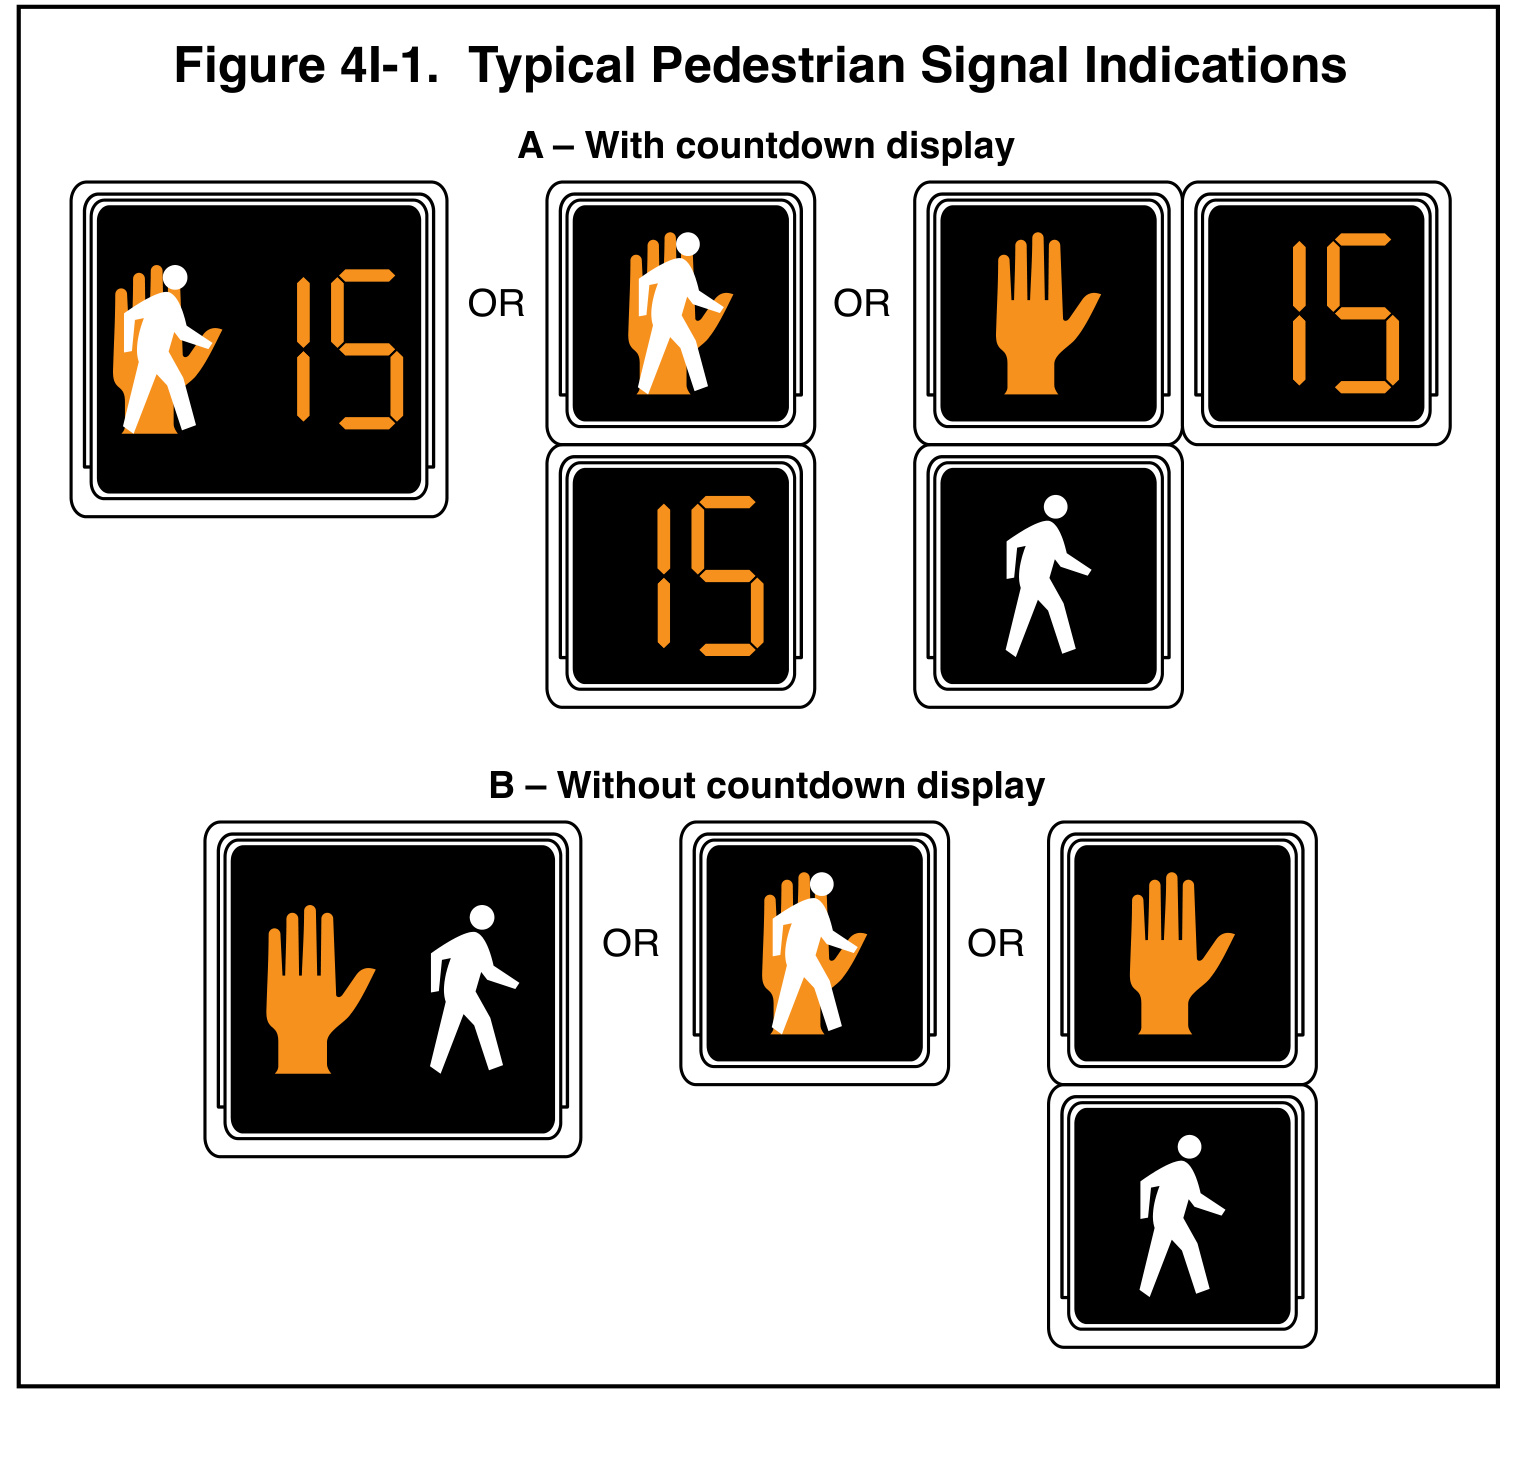
These are display-layout illustrations, not snapshots of a simultaneous operating state. The countdown can share a panel with the symbols or occupy a separate panel; the operating sequence still determines which indications appear and when. The number 15 is illustrative. It does not prescribe a 15-second interval for the crossing, nor does a matching layout establish that the controller timing is correct.
Display size is a separate decision
The countdown numbers must be Portland orange, at least six inches high, on a black opaque background, immediately adjacent to the associated upraised hand. Where the pedestrian enters the crosswalk more than 100 feet from the countdown display, the manual recommends numbers at least nine inches high. The first provision is a Standard; the long-distance provision is Guidance. (MUTCD pedestrian control provisions)
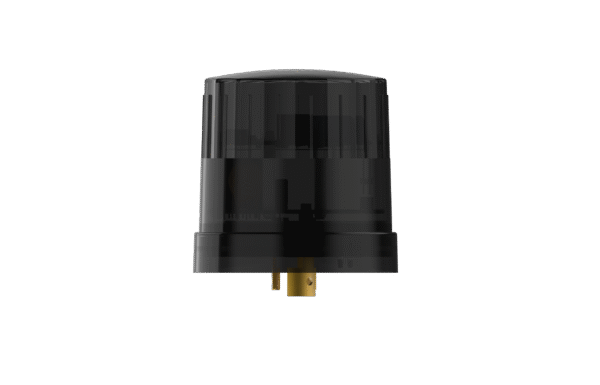
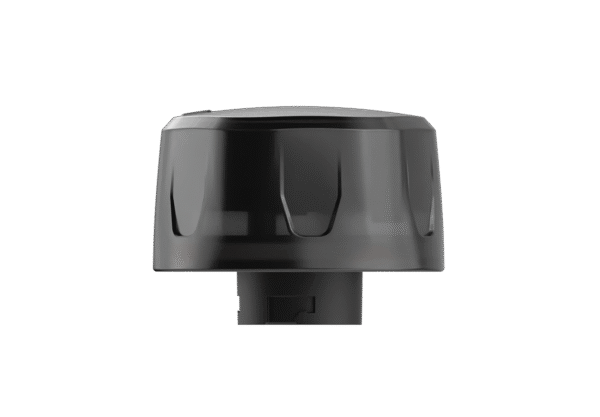
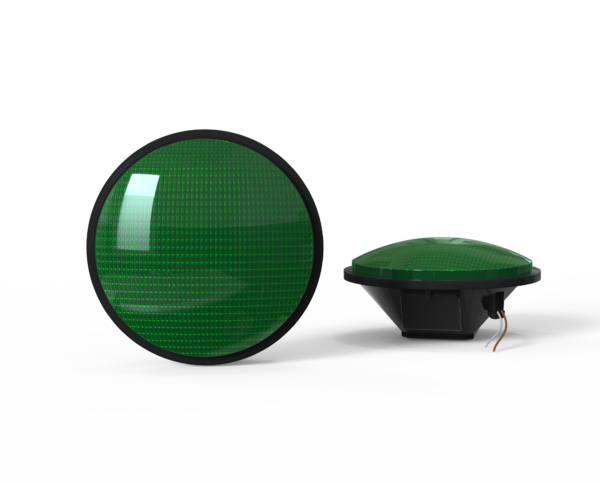
A product's nominal module size does not answer the digit-height question. LEOTEK's reviewed SPC AC sheet gives a 455-by-405-mm module envelope and a nine-inch countdown digit height. Those are two different dimensions. Its drawing is a product reference, not a determination that every installation of that module meets the full crossing design. (LEOTEK SPC 80-135 Vac specification)
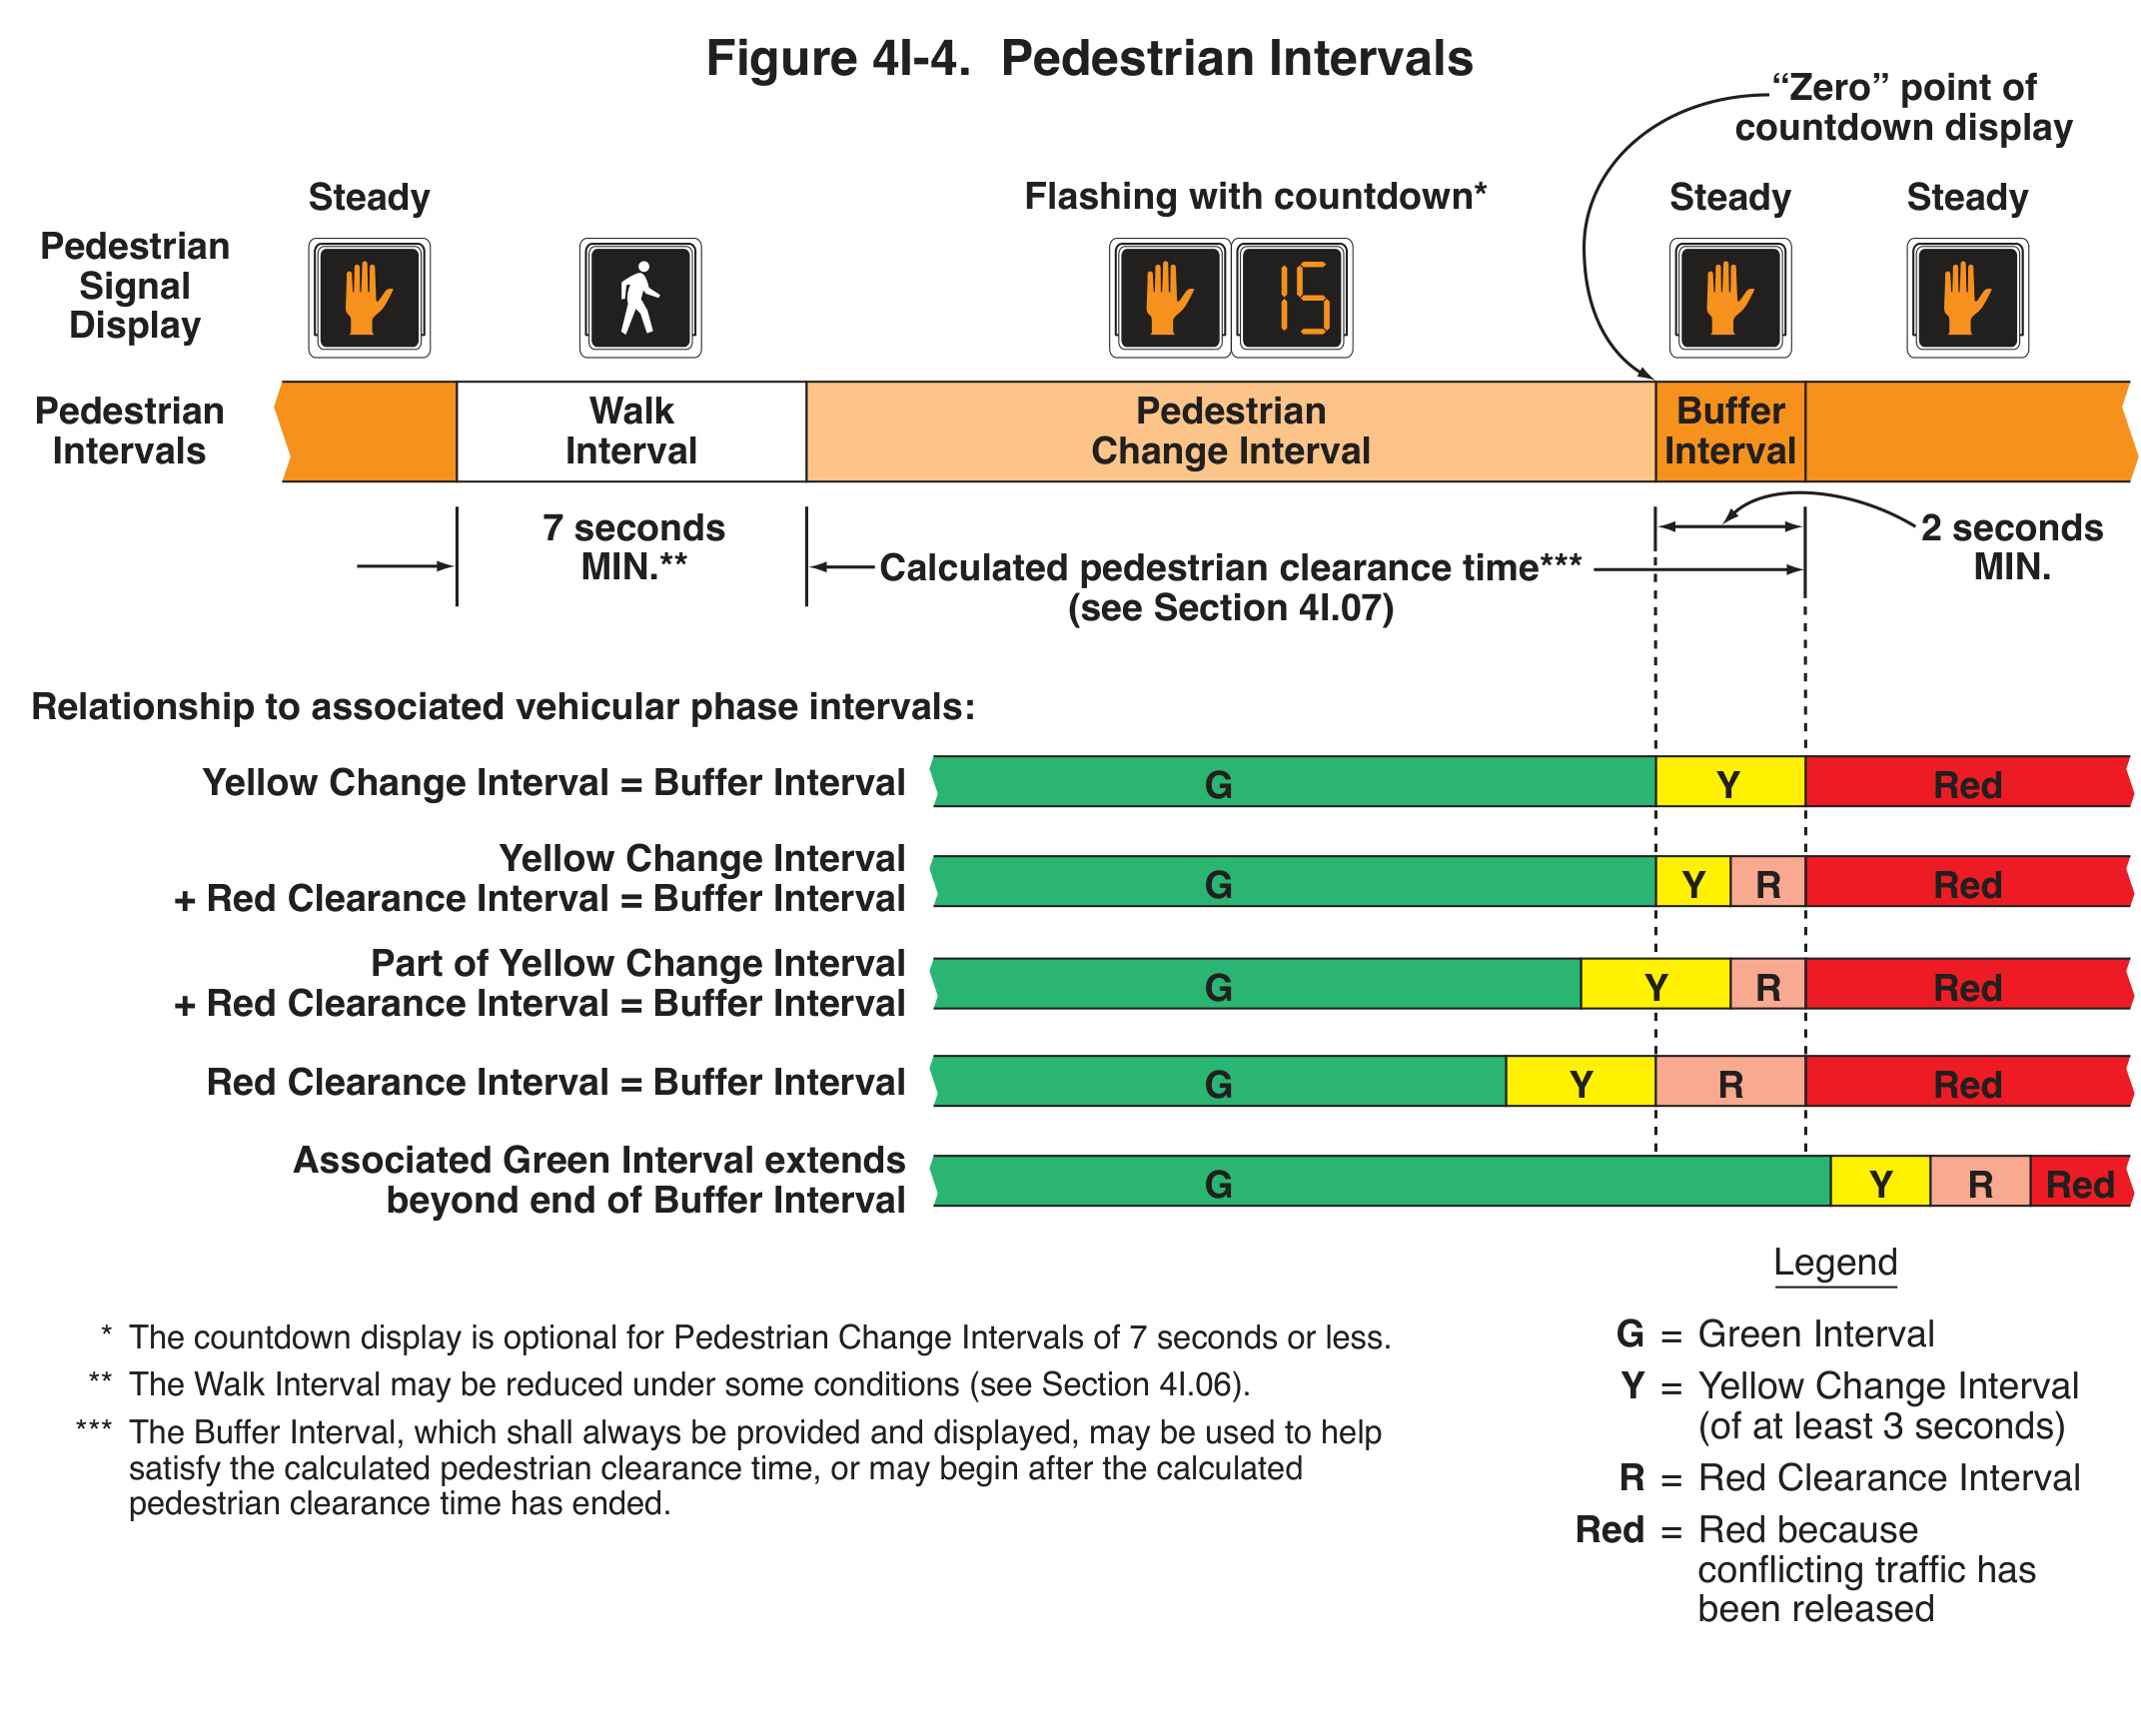
The countdown belongs to the pedestrian change interval, shown with the flashing hand. The zero point marks its transition to the steady-hand buffer interval. Notice that the calculated pedestrian clearance time is identified separately: it should not be treated as another name for the countdown interval. The lower examples show several possible relationships with the associated vehicle phases. Their legend and footnotes are essential to interpreting the colored bars; this figure is an operating explanation rather than a project timing plan.
What the FHWA safety study does and does not show
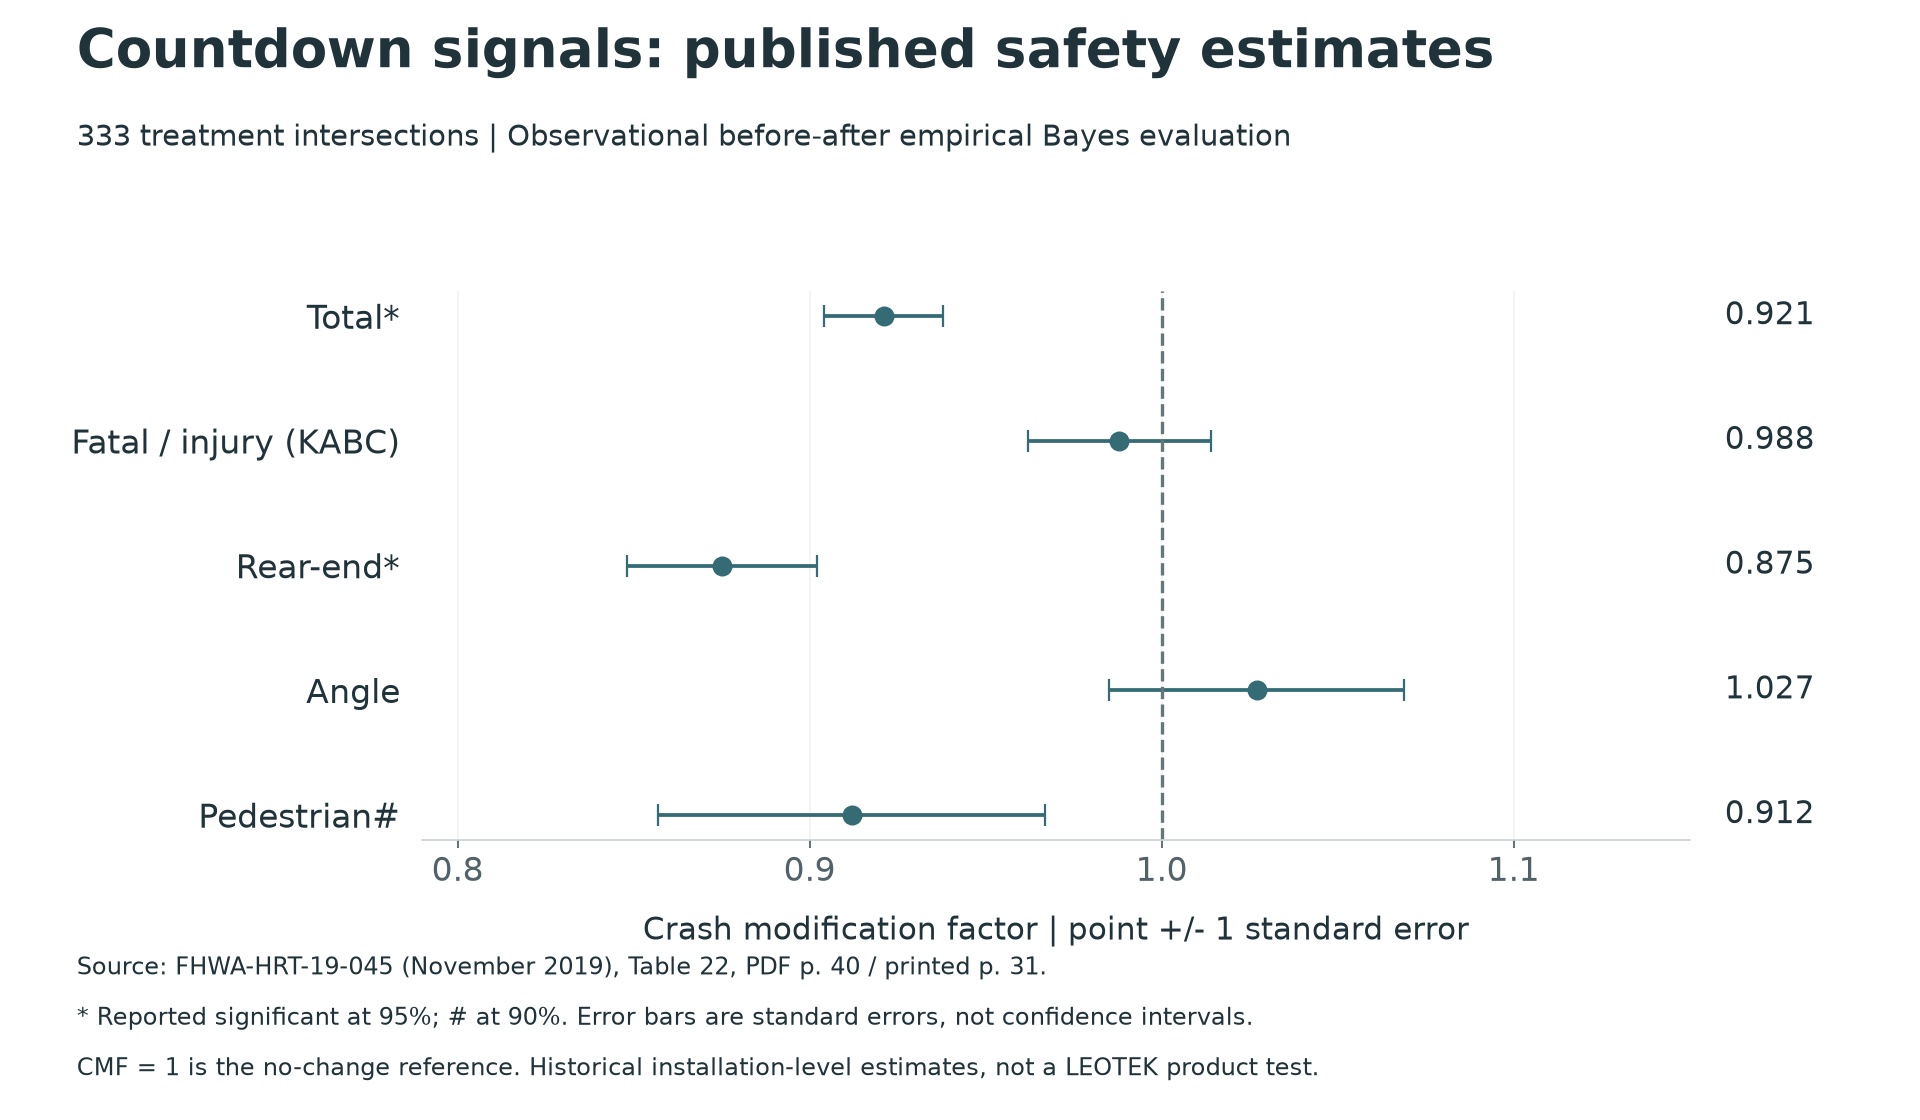
FHWA's 2019 evaluation studied 333 treatment intersections in Charlotte and Philadelphia using an observational before-after empirical Bayes method. Its combined results included a total-crash modification factor of 0.921 and a pedestrian-crash factor of 0.912. The total result was significant at 95%; the pedestrian result was significant at 90%. The injury and angle results did not show statistically significant changes at those reported levels. (FHWA Safety Evaluation of Pedestrian Countdown Signals)
Keep that uncertainty visible. The study supports a discussion of countdown deployment, but it does not measure a particular SPC model or establish that its internal conflict monitor caused the reported outcomes. The accompanying chart retains all five crash categories and labels its error bars as standard errors, not confidence intervals.
| Crash type | Observed after | EB expected after without treatment | Crash modification factor | Standard error | Reported significance |
|---|---|---|---|---|---|
| Total | 4499 | 4885.8 | 0.921 | 0.017 | 95 percent |
| KABC injury | 2257 | 2283.8 | 0.988 | 0.026 | not significant at 90 or 95 percent |
| Rear-end | 1542 | 1761.3 | 0.875 | 0.027 | 95 percent |
| Angle | 927 | 901.9 | 1.027 | 0.042 | not significant at 90 or 95 percent |
| Pedestrian | 397 | 434.9 | 0.912 | 0.055 | 90 percent |
Countdown signal crash modification factors. Data transcribed from the cited source; original column values retained.
Source: T03, PDF page 40, Table 22. Original source 1
Aggregate published estimates, not raw crashes/participants or causal randomized experiment. No current LEOTEK module effect. SE is not a confidence interval. 115 Charlotte + 218 Philadelphia treatment sites; 136 + 597 reference sites
The visual display is only part of the crossing
Accessible pedestrian signals communicate timing in nonvisual formats as well. A visible countdown does not supply audible or vibrotactile information by itself. Review the display alongside the crossing's accessible signal equipment and its applicable project requirements. (MUTCD pedestrian control provisions)
For a product discussion, identify the intended voltage, head fit, symbol arrangement and countdown behavior first. LEOTEK's SPC sheet can then support the component questions. The controller timing and complete crossing design need their own review. (LEOTEK SPC 80-135 Vac specification)
A crash-modification factor is not a guarantee for the next intersection
The FHWA study's total-crash factor of 0.921 corresponds to an estimated 7.9 percent reduction relative to the modeled counterfactual. It does not mean that 7.9 percent of all crashes at every treated intersection were prevented, or that any particular module model delivers that result. The estimate belongs to the evaluated treatment and study design. FHWA's countdown-signal report describes the underlying before-after empirical Bayes evaluation.
For an illustrative interpretation, a counterfactual expectation of 100 relevant crashes multiplied by 0.921 becomes 92.1 expected crashes under that factor. The difference is 7.9 in that hypothetical expectation, not an observation from a specific LEOTEK installation. A real forecast would require a justified applicable estimate, baseline prediction and uncertainty treatment. The arithmetic explains the factor without presenting a project forecast.
Read the five rows before quoting the most attractive one
The study reported different estimates for total, injury, rear-end, angle and pedestrian crashes. A total-crash result does not establish the same change for every category. The injury and angle estimates did not show statistically significant changes at the reported levels. A category with an estimate near no change should remain visible even if another category appears more favorable.
The pedestrian estimate also used a different reported significance level from the total and rear-end results. That distinction belongs in a technical summary. Removing it makes the evidence appear more uniform than it is. The chart retained here shows standard-error bars; they are not 95 percent confidence intervals. A short visual label can change the meaning of a result, so the source, estimator and uncertainty definition travel with the graphic.
The study evaluated 333 treated intersections and used 733 reference intersections in two cities. It was an observational evaluation, not a randomized comparison of LEOTEK against another brand. Its empirical Bayes approach was used to address the before-after evaluation problem. For the detailed method and limitations, use FHWA's countdown-signal report rather than interpreting raw before-and-after totals as an isolated causal result.
Why an attractive countdown can still leave an operating problem
A number on a display does not determine the controller's approved pedestrian timing. The change interval, buffer and other applicable intervals need to be understood within the governing sequence. Replacing a module should not become an informal opportunity to reinterpret the required clearance timing. The responsible designer and agency need to resolve that timing basis.
Consider an illustrative acceptance discussion: the hand symbol and digits are visible, but nobody has observed the transition into WALK or the behavior after zero. A still photograph confirms neither transition. The review needs an expected-state sequence derived from MUTCD pedestrian control provisions, then observations appropriate to the agency's procedure. The useful question is whether the installed display follows that sequence, not whether the photograph looks like a countdown product.
Separate the display decision from the accessible crossing decision
A visual countdown is one element of the pedestrian environment. Pushbutton location, accessible pedestrian information, crossing geometry and other project requirements need their own review. A brighter visual display does not establish that a person who cannot use that display receives the required information. The Public Right-of-Way Accessibility Guidelines resource is relevant to the broader accessible public-right-of-way discussion; applicability depends on the governing requirements and project scope.
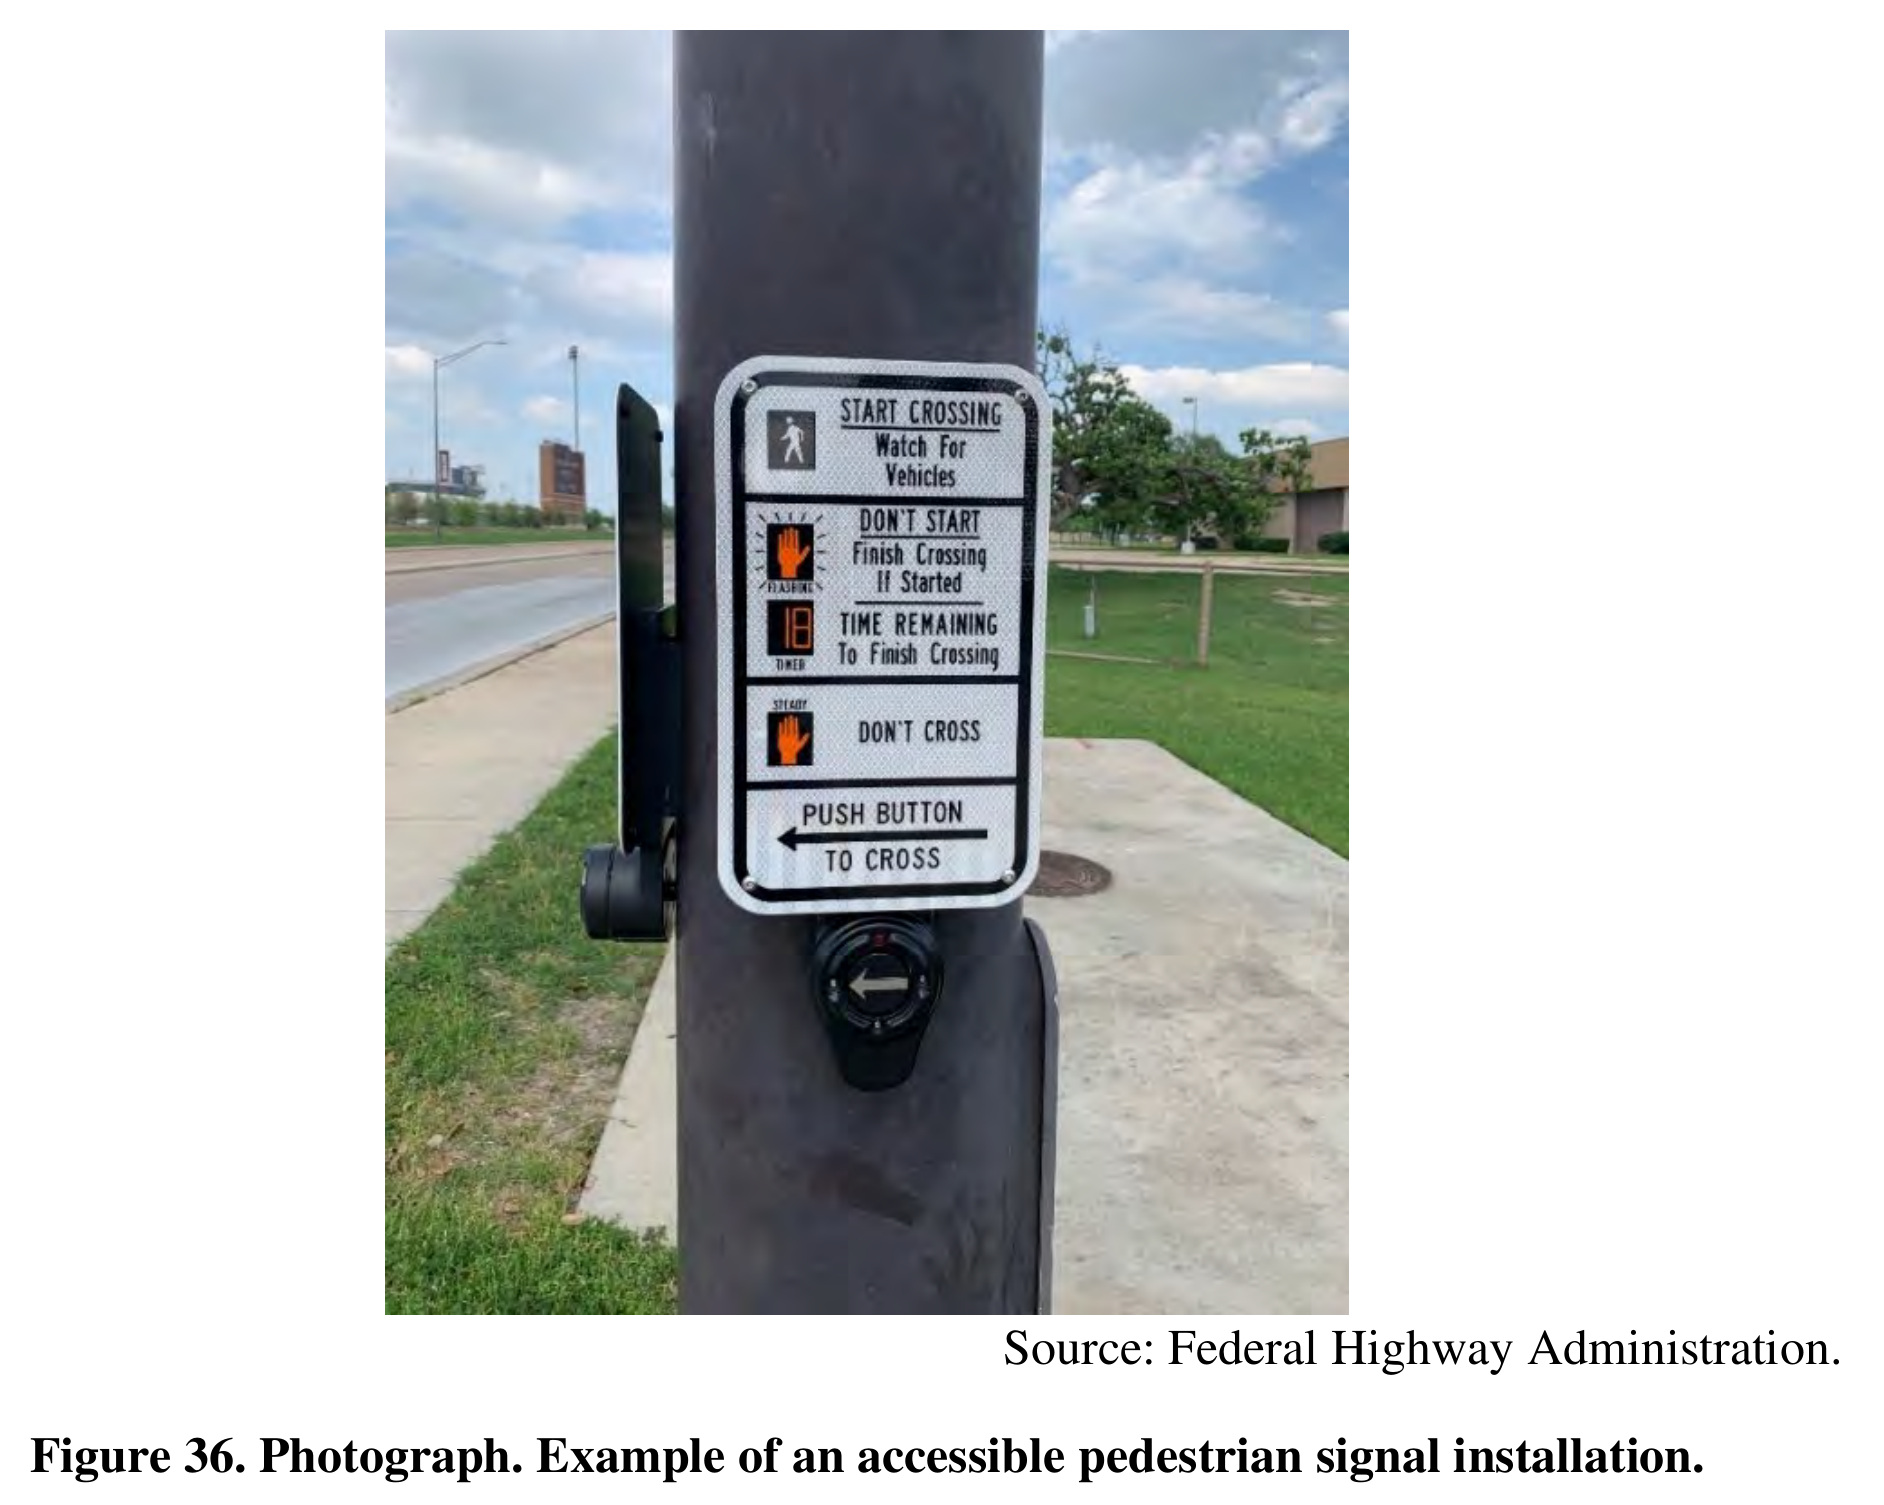
The handbook photograph makes a separate component visible: accessible pedestrian signal equipment at the crossing. Review the button’s position, the information a person receives and the operating sequence alongside the visual display. A specification for a countdown module should state which functions belong to that module and which depend on other equipment and the site layout.
This is an FHWA installation example. The photograph helps identify the scope of the review; the project’s governing requirements and complete installation determine compliance.
That wider boundary is important when preparing a procurement specification. State what the module supplies and what the complete installation must accomplish. Otherwise, a well-documented component can be credited with functions that actually depend on other equipment or the layout. Configuration-specific electrical and optical records remain necessary even when the general safety literature supports the treatment concept.
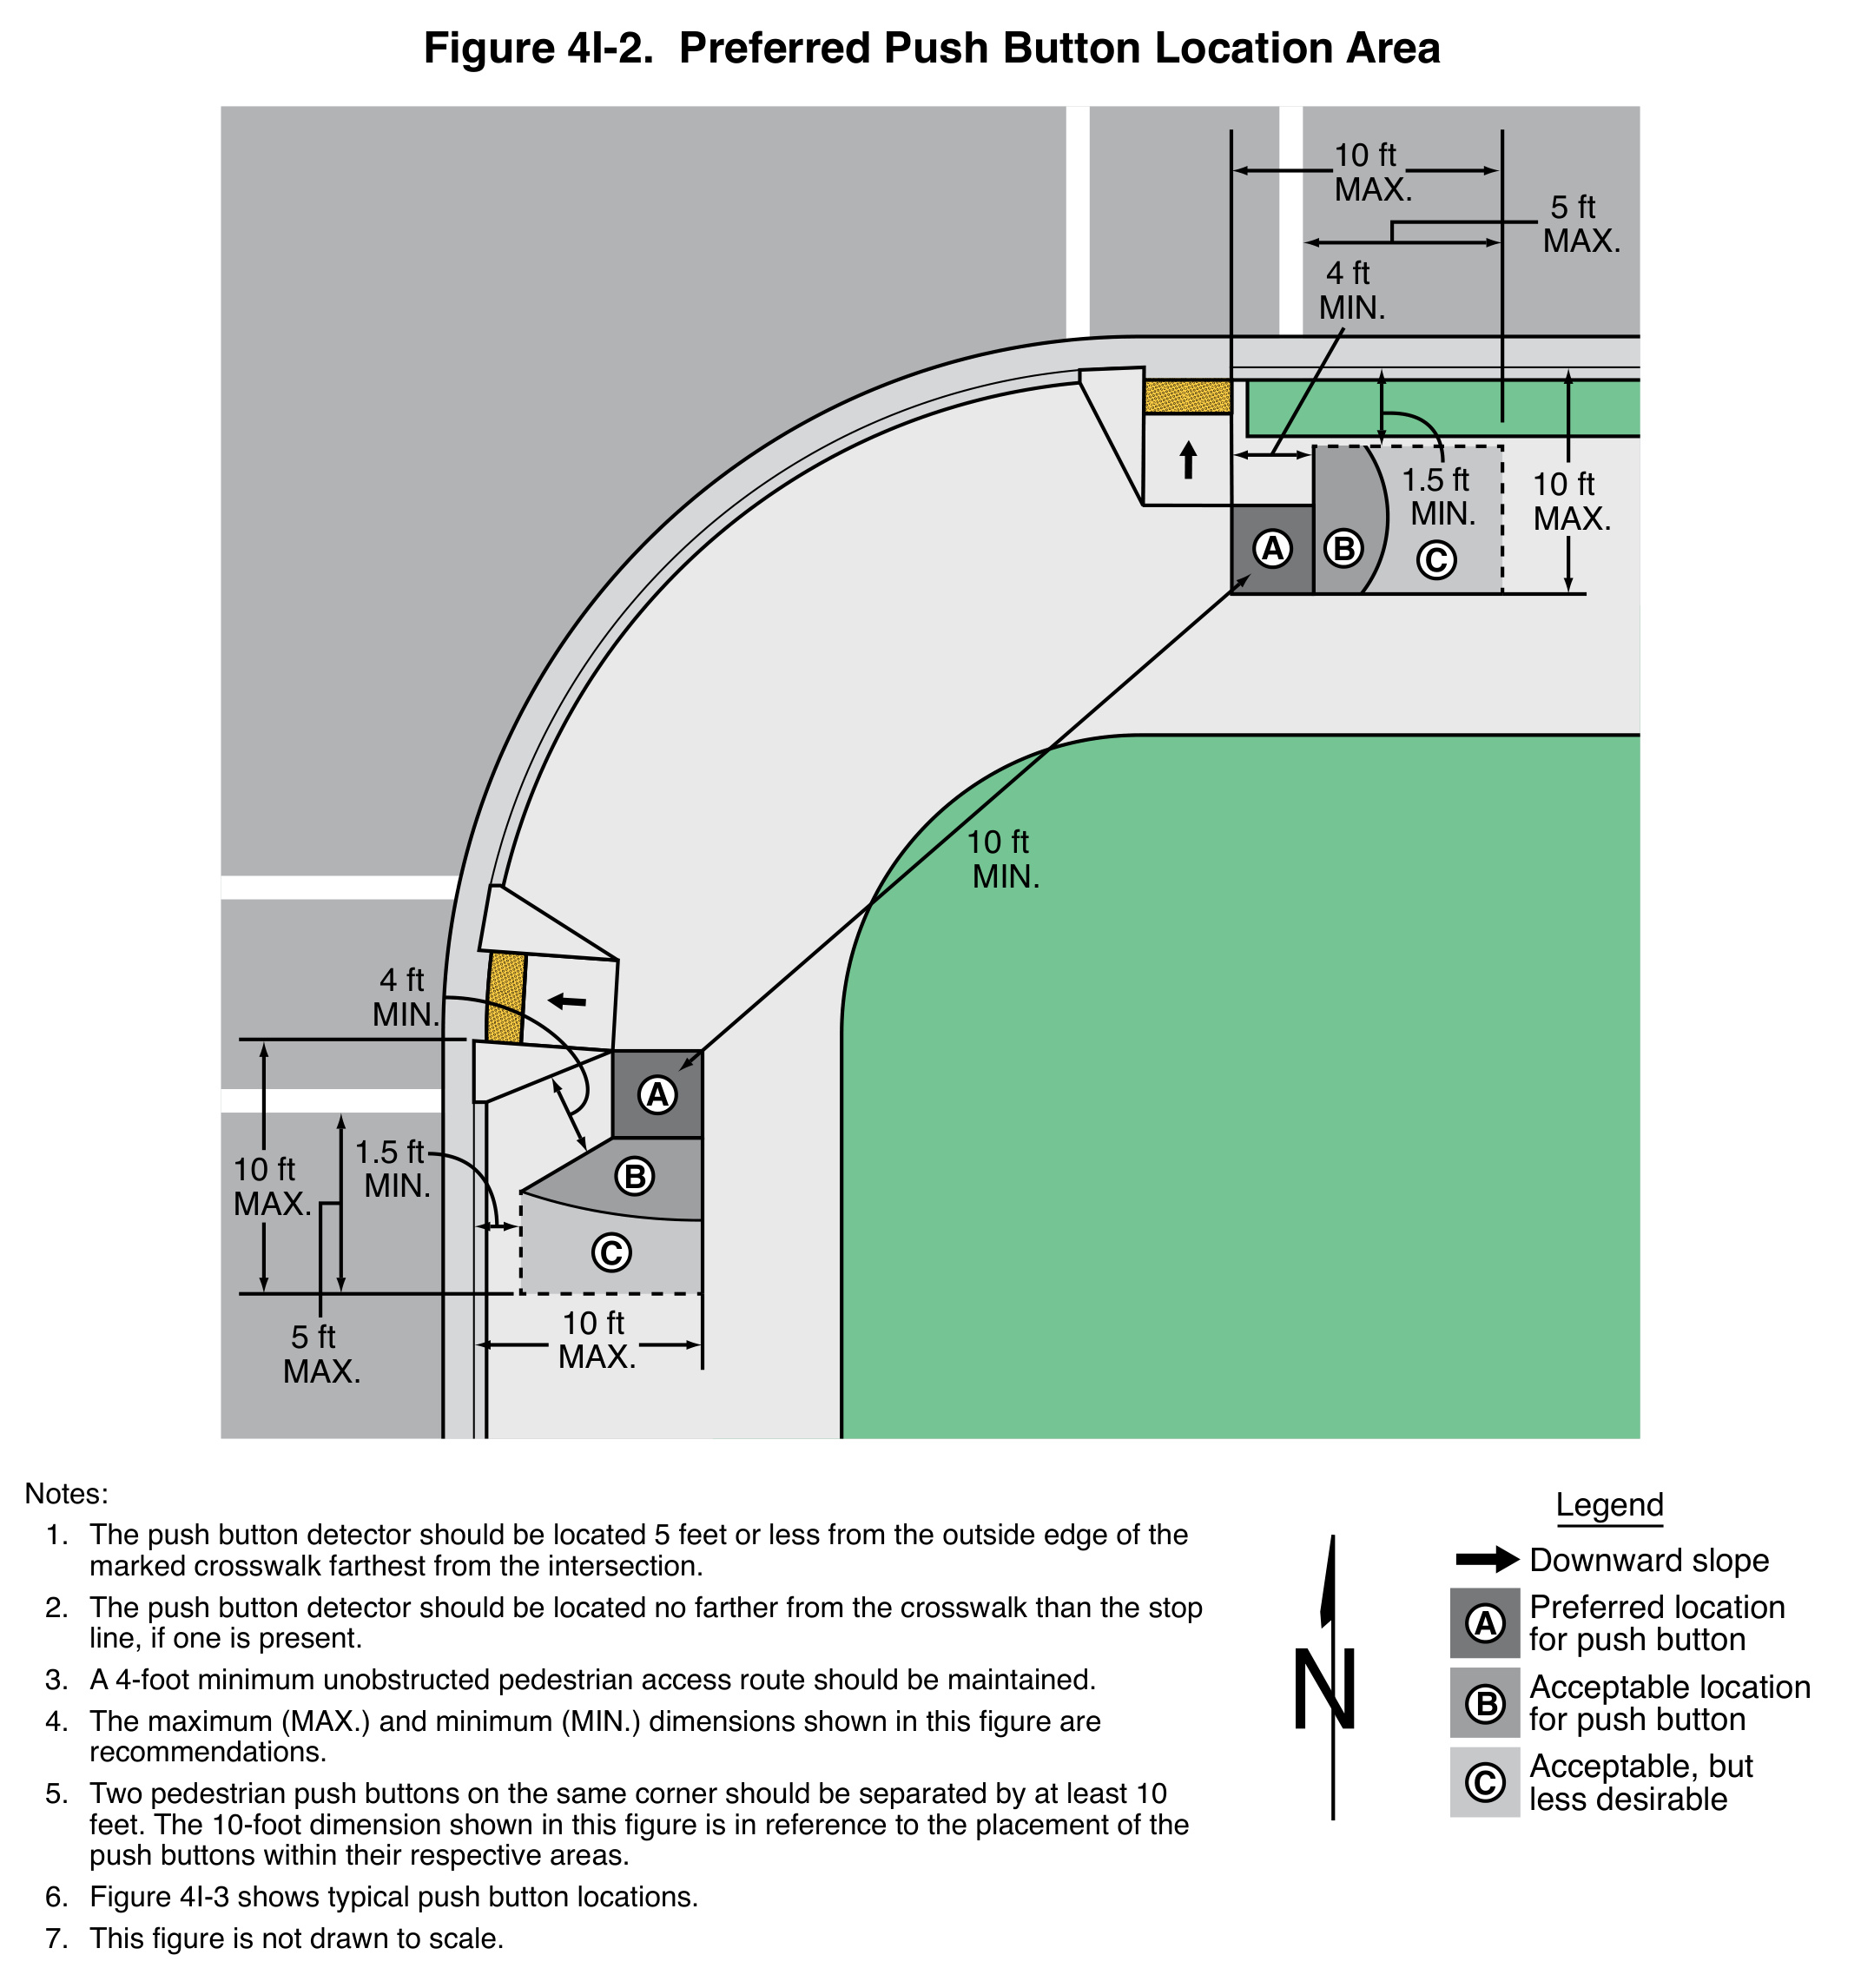
Read the location areas with the notes: A is preferred, B is acceptable, and C is acceptable but less desirable. The figure identifies the shown maximum and minimum dimensions as recommendations and states that it is not drawn to scale. Keep those qualifications with the drawing. A position that looks convenient on a photograph still needs review against the crossing geometry, unobstructed access route and applicable accessibility requirements; a visual countdown module does not resolve those installation questions.
What should change in the project brief after reading the research?
The brief should identify the intended operating sequence, the applicable display requirements, the exact supplied configuration and the commissioning evidence. If safety research is used to explain the project rationale, retain the study population, method, outcome categories and uncertainty. If a financial model includes a safety benefit, its assumptions require separate justification; the product brochure does not supply them.
This is the practical value of the DOT chart: it opens a better discussion about evidence. It shows both promising estimates and the limits of what was demonstrated. An agency can use that information to ask sharper design and evaluation questions without turning a treatment-level study into a model-specific performance promise.
Frequently asked questions
Does a countdown show how long a pedestrian may wait before starting?
No. It accompanies the flashing upraised hand and reports time remaining in the change interval. It should not be presented as permission to start a new crossing. (MUTCD pedestrian control provisions)
Should the display keep showing zero?
After zero, the countdown must remain dark until the next countdown begins. It must not continue displaying a number through WALK. (MUTCD pedestrian control provisions)
Can the FHWA study prove one manufacturer's module is safer?
No. It evaluated countdown installations using aggregate intersection crash data. Its results are not a comparative test of LEOTEK or any other module brand. (FHWA Safety Evaluation of Pedestrian Countdown Signals)
Sources
- MUTCD pedestrian control provisions. Sections 4I.01-4I.04, PDF pages 759-761 / printed pages 718-720
- LEOTEK SPC 80-135 Vac specification. Revision November 13, 2018; drawing page 1, model and standard entries page 2
- FHWA Safety Evaluation of Pedestrian Countdown Signals. FHWA-HRT-19-045, November 2019; Table 22, PDF page 40 / printed page 31
Additional research and calculation basis
- FHWA-HRT-19-045 (November 2019), Table 22 and evaluation method
- MUTCD pedestrian control provisions, Sections 4I.01-4I.04
- U.S. Access Board, Public Right-of-Way Accessibility Guidelines resource
Cover image: AI-generated editorial illustration for LEOTEK. The generic scene is not a verified installation, product photograph or test record. Technical figures and tables carry their own source credits.