



A total-lumen number does not tell a signal reviewer how much light is directed toward the driver. That is the first reason to keep luminous flux and luminous intensity separate.
Candela is the SI unit of luminous intensity. Lumens describe luminous flux. Direction is central to an intensity comparison, so a signal's angular photometric requirements cannot be replaced by a single total-output number. (NIST luminous-intensity reference)
Compare the specified quantity
Start with the metric, units and measurement conditions required for the indication. Retain the relevant horizontal and vertical positions when reviewing intensity data. A centerline value alone does not establish the result at every required viewing position.
Wattage is electrical input, not an optical test result. Two modules can consume different power without providing the same directional output. LED count is not a substitute either: it does not describe the complete optical system.
Read a real model-table example
The reviewed IL6-P3 DC sheet lists the standard 12-inch yellow module at 10 W and 910 cd minimum maintained intensity. Its yellow ULP version lists 4.5 W and 410 cd, with a different Standard entry. Those rows cannot be treated as equivalent offers compared only on watts. (LEOTEK IL6-P3 10-28 Vdc specification)
The point is not to choose one row universally. It is to establish which output and documented requirements the application needs before comparing energy use.
| Model | Indication | Input | Watts | Minimum maintained intensity (cd) | Standard entry | Source revision |
|---|---|---|---|---|---|---|
| TSL-12Y-LX-IL6-B1-P3 | 12-inch yellow circular | 10-28 Vdc | 10 | 910 | ITE 2005* | 07-01-2019 |
| TSL-12Y-LX-IL6-B1-P3-ULP | 12-inch yellow circular ULP | 10-28 Vdc | 4.5 | 410 | N/A | 07-01-2019 |
| TSL-12R-LX-IL6-B1-P3 | 12-inch red circular | 10-28 Vdc | 4.4 | 365 | ITE 2005* | 07-01-2019 |
| TSL-12R-LX-IL6-A1-P3 | 12-inch red circular | 80-135 Vac | 6.2 | 365 | ITE 2005/ETL/Caltrans | 12-12-2018 |
Entries transcribed from manufacturer model tables. The listed qualification text is the sheet's statement, not a newly verified agency approval.
Source: IL6-P3 DC sheet 07-01-2019, page 2; AC sheet 12-12-2018, page 2. Original source 1, Original source 2
Different colors and voltages are not equivalent benchmark cases. The yellow ULP row has a different intensity and N/A Standard entry. Values are published specifications, not new measurements; request current exact-model evidence.
Distinguish appearance from measurement
Illinois' 2009 survey found that all 103 respondents in its vehicle-factor portion selected brightness as important. That is a subjective importance result, not a measurement of module intensity or proof that the brightest sample was the best product. (Illinois DOT / ICT-09-043 (2009))
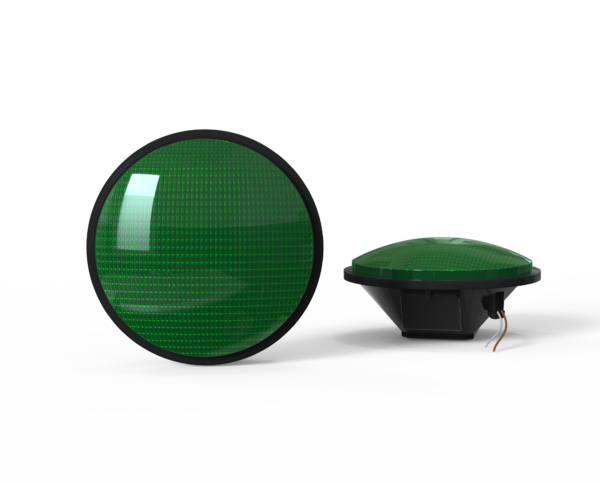
A photograph introduces another boundary: exposure, distance and display settings can change apparent brightness. Use the photograph for context and the specified photometric record for the acceptance conclusion.
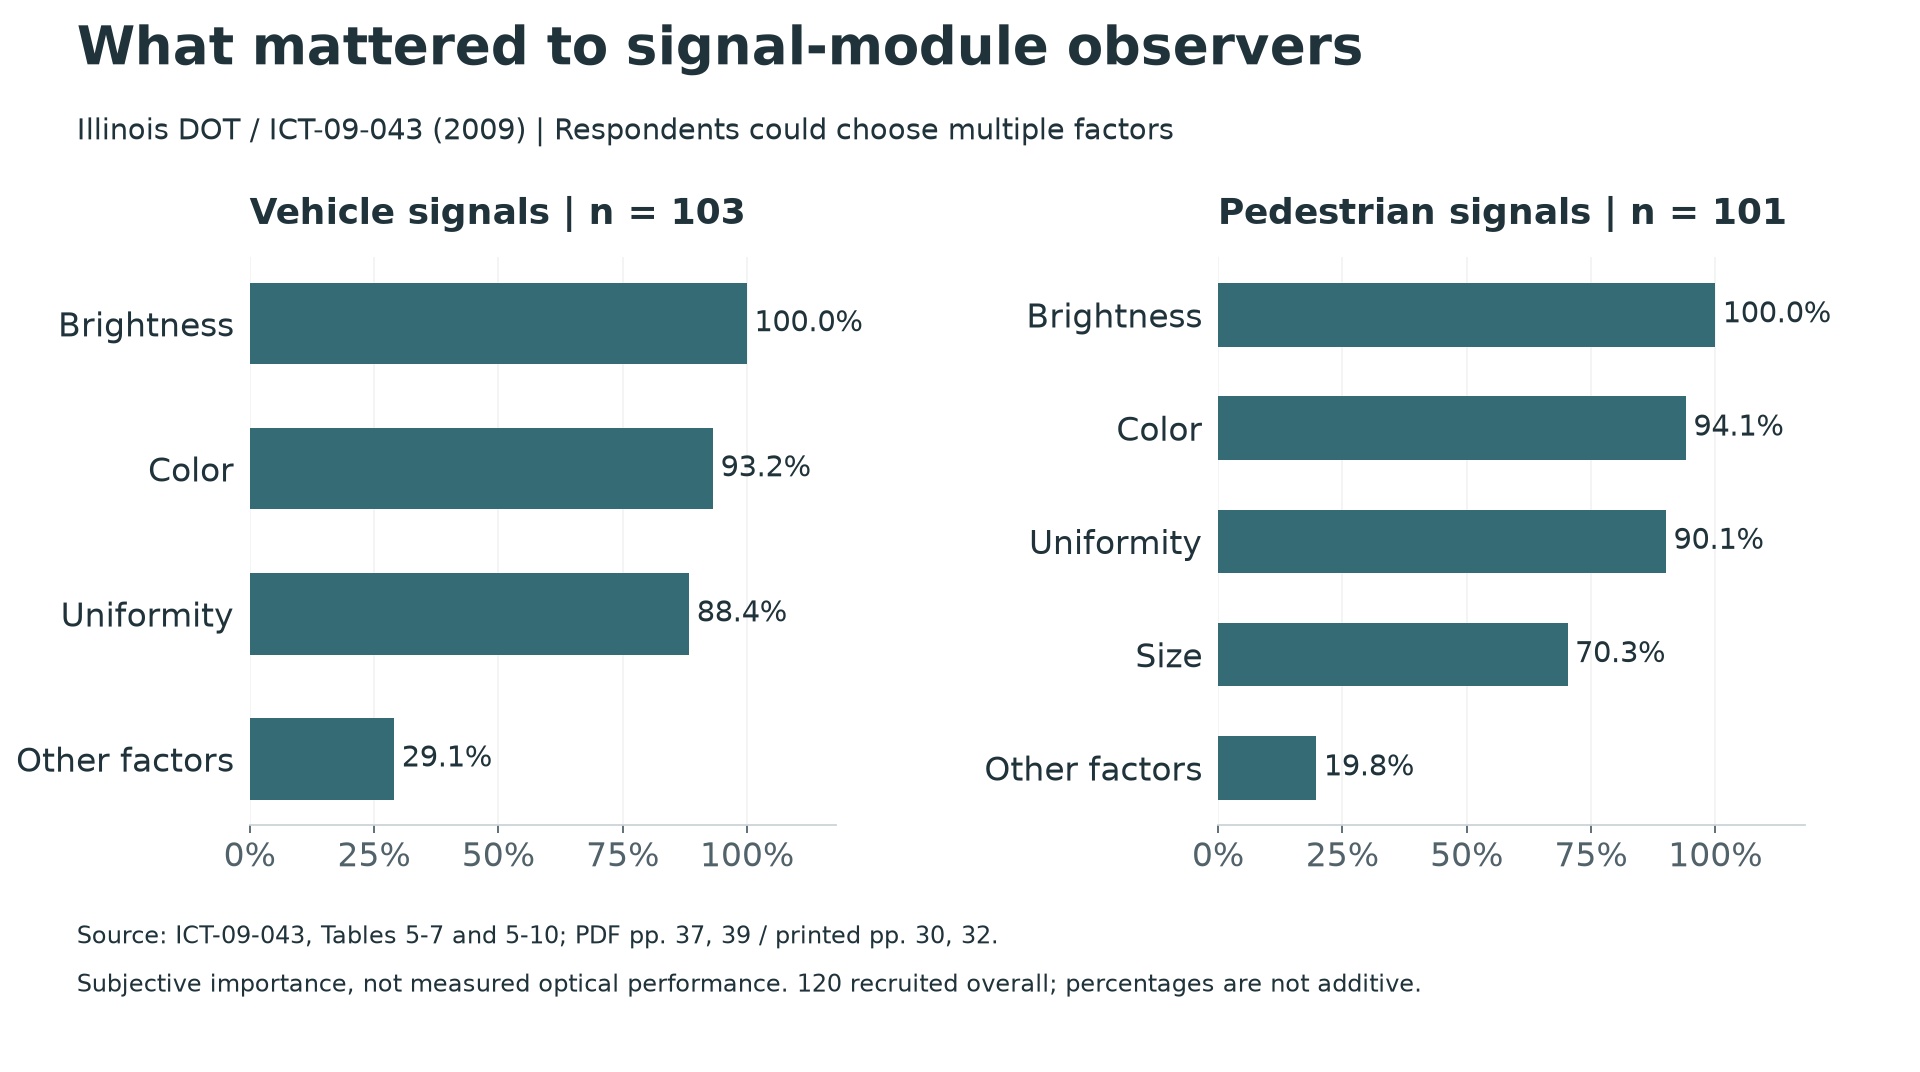
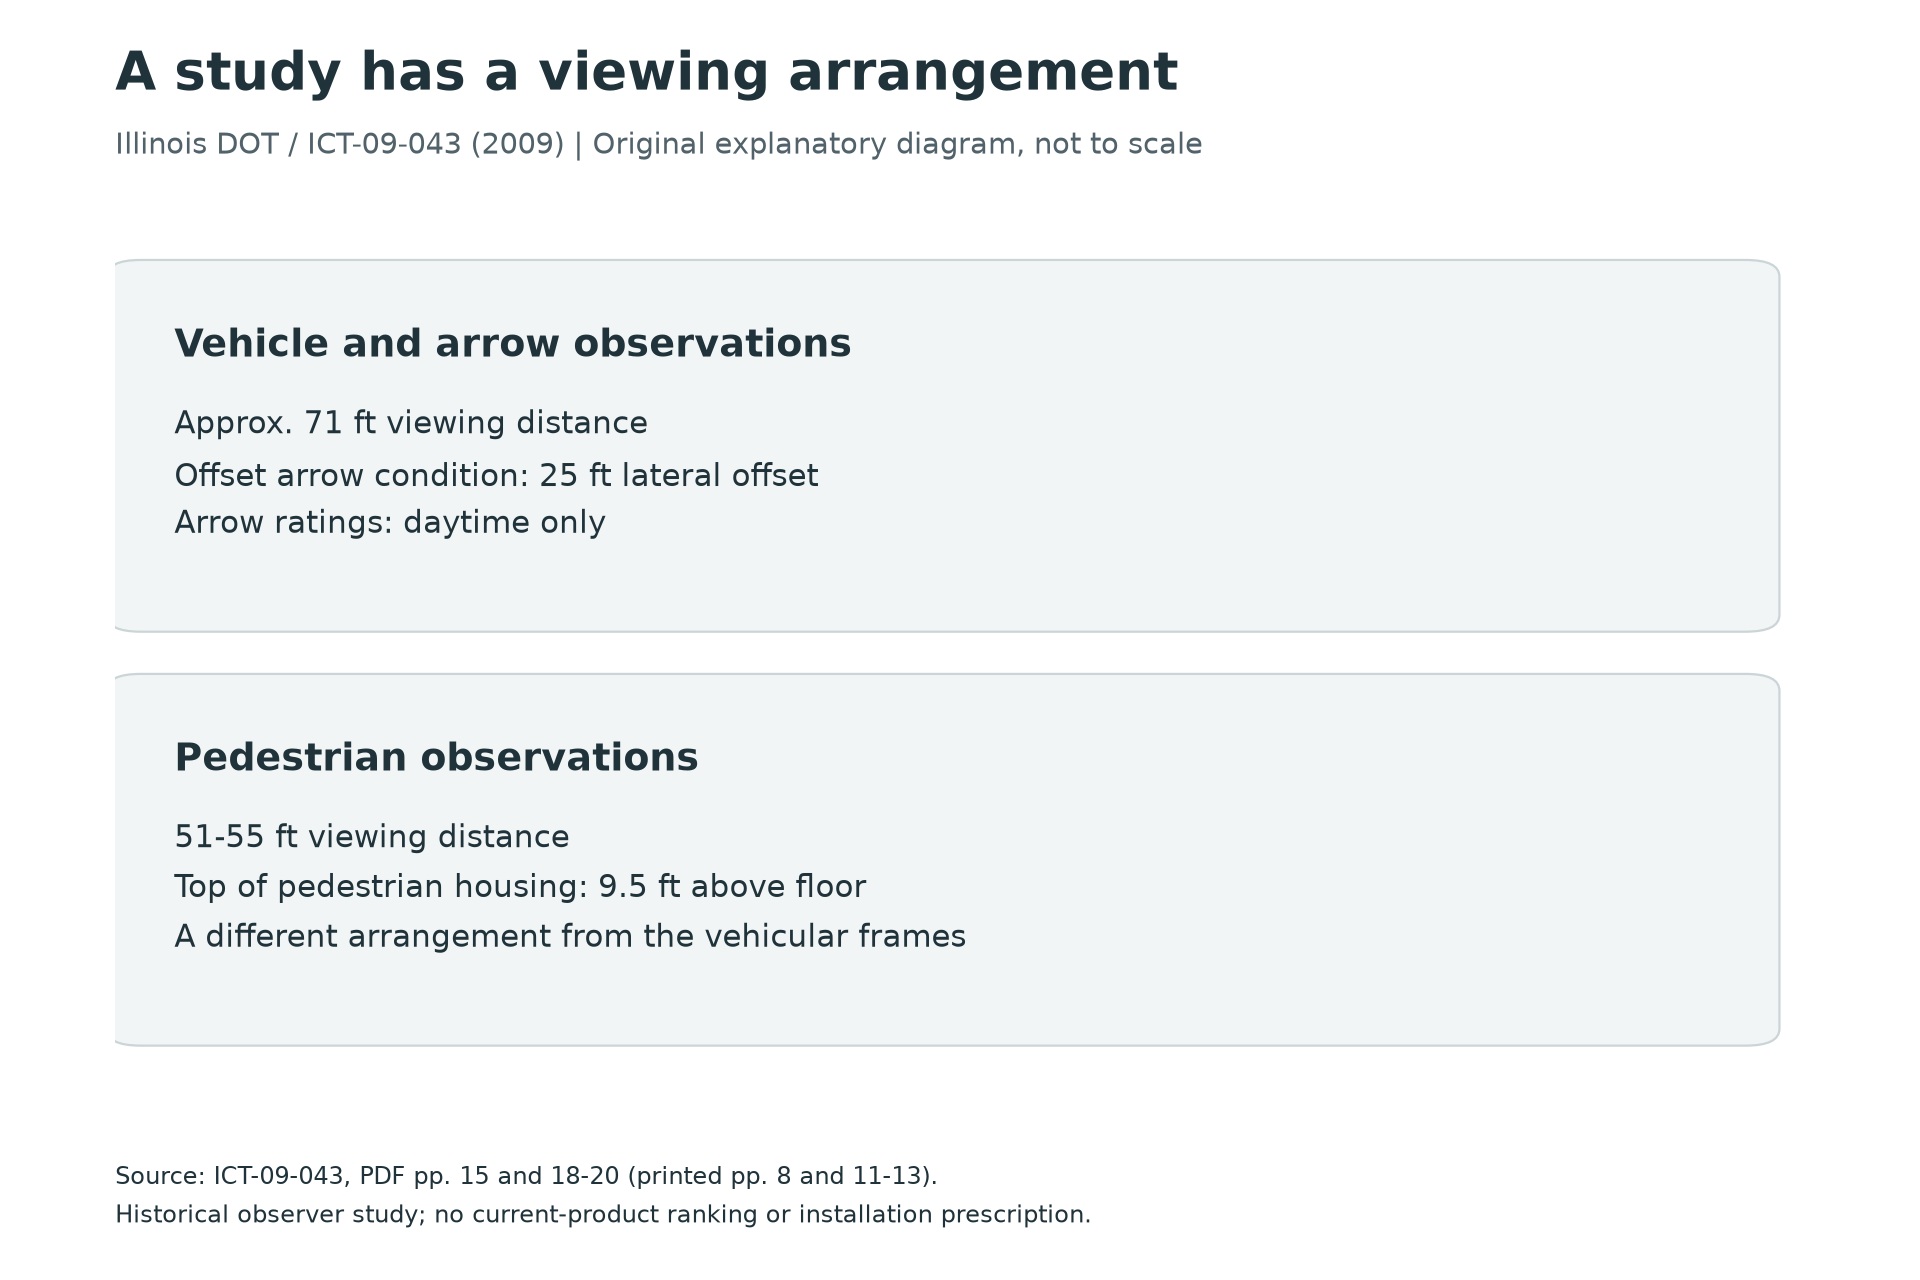
The straight and offset views help explain why an observer can report a different appearance without the module changing. They do not turn a survey response into a candela measurement. The source report also separates its compliance-review work from the driver-preference survey. Retain that distinction when using either the photograph or the ratings chart in a product discussion.
Ask what 'maintained' means
Keep the stated output threshold, operating duration and test or substantiation basis with a maintenance claim. Do not turn an hours statement into a warranty or installed-life guarantee. The product comparison should preserve both the optical quantity and the conditions behind it.
Why more total light can still leave the relevant direction unresolved
Luminous flux describes light integrated across directions; luminous intensity describes the directional quantity. A useful analogy is a budget and its allocation. Knowing the total budget does not show how much reaches one department. Likewise, a total-lumen statement alone does not show the intensity sent toward a driver's viewing position. This is an explanatory analogy, not a mathematical equivalence between a signal and a roadway luminaire.
The photometric relationship is flux equals the integral of intensity over solid angle. If intensity were constant over a defined solid angle, flux over that region would equal intensity multiplied by that angle in steradians. Real optical distributions are not necessarily constant. Without the distribution and integration boundary, a candela value cannot be converted into a unique total-lumen value. NIST's candela reference supplies the measurement-unit background for this distinction.
For a signal comparison, the practical implication is specific: request the quantity and angular conditions required by the applicable specification. A single attractive number may describe a center direction, a minimum over specified directions, an initial result, or a maintained claim. Those statements are not interchangeable. A more complete report can be commercially more useful than a larger isolated number because it lets the reviewer answer the actual acceptance question.
Angular position changes as a driver approaches
An illustrative geometry calculation shows the issue without prescribing a signal layout. Assume a lateral separation of 25 feet between a viewing line and the signal. At a longitudinal distance of 200 feet, the horizontal angle is arctan(25/200), about 7.1 degrees. At 100 feet it is about 14.0 degrees; at 50 feet it is about 26.6 degrees. These are calculated examples, not installation criteria or measured signal performance.
The offset has not changed, but the angular viewing position has. That is why a head that appears satisfactory from one distant observation point still needs review for the approach and stopping positions addressed by the design. It also explains why two photographs taken from different positions are weak evidence for comparing optical performance. The camera may have moved to a different part of each module's angular distribution.
Use this calculation to plan questions, not to approve a head. The applicable design provisions, signal aiming, approach geometry and required optical evidence determine the review. The 2009 Illinois study in the original Illinois report is useful precisely because it documented viewing conditions; its observer ratings should not be promoted into a contemporary angular-intensity certification.
What the observer study adds beyond a brightness number
The study's multi-select questions let participants identify factors they considered in rating modules. That makes the chart a record of reported judgement, not an instrument reading. A respondent choosing brightness and uniformity contributes to more than one category. The bars therefore need not total 100 percent. Treating them as a market-share distribution would change the meaning of the result.
The engineering insight is that perceived acceptability can involve several visible properties at once. A module may attract attention yet still raise questions about color, face appearance or visibility from a particular position. The study cannot rank today's products for every application, but it helps explain why a procurement review should connect objective measurements with the actual viewing task.
For a comparison meeting, keep three artifacts side by side: the specified photometric requirement, the configuration-specific report, and an approach sketch identifying where the observer is located. Add a photograph only as contextual documentation with position, exposure and conditions recorded. This is a proposed evidence format. It avoids asking a camera image to prove something that belongs in a test report.
The final decision should state which measurement supports which requirement and what remains unverified. That is a stronger technical conclusion than choosing the highest-lumen description, and it gives the supplier a precise request when additional evidence is needed.
A simple measurement can answer the wrong question very precisely
Suppose two hypothetical signal modules produce the same total lumens but distribute that light differently. One concentrates more output around the central direction; the other spreads it across a wider set of directions. Neither description, by itself, establishes compliance. The project needs the relevant directional measurements and limits. A single central reading cannot reconstruct the complete distribution, just as total lumens cannot identify the intensity seen from an offset lane.
Illuminance measured at a detector is another quantity again. In an idealized far-field geometry, with the detector facing the source and negligible intervening loss, illuminance is approximately intensity divided by distance squared. A hypothetical 200-candela source gives about 2 lux at 10 metres and 0.5 lux at 20 metres. This is a dimensional illustration, not a signal acceptance test: an actual test requires the prescribed geometry, instrument and conditions. The definitions of the photometric quantities are grounded in NIST's candela reference.
That example explains an easy comparison error. A light-meter reading taken at twice the distance cannot be compared directly with the first reading and interpreted as a fourfold deterioration. Distance changed the measurement. If detector orientation, background or the sampled direction also changed, the interpretation becomes still less direct. Keep the geometry with the result rather than recording a number stripped of its setup.
Read the test report as a set of conditions
A useful photometric record identifies the tested configuration, measurement directions, electrical input and the conditions required by the cited method. Ask whether the report belongs to the offered voltage and indication. Also distinguish a measured value from a minimum specification and a typical catalog value. A table headed typical performance describes a different commitment from a project acceptance limit.
For example, an illustrative measured value of 110 against a minimum of 100 has a numerical margin of 10 units. It does not automatically establish the same margin at every angle, temperature or point in service life. Nor does it tell the reader how measurement uncertainty was handled. Request the applicable method and acceptance basis rather than inventing a universal safety factor from those two values. A larger number is meaningful only after the quantity and conditions agree.
The historical Illinois observer study is useful precisely because it asks a different question: how participants judged the presented signals under its study conditions. the original Illinois report provides that context. A preference response can help frame a visibility discussion, while an intensity test addresses specified optical performance. Treating the survey as a replacement for photometry would lose the useful distinction between an observer's experience and an instrument's measurement.
Ask for the evidence that would change the selection
Before requesting another report, state the uncertainty. If it concerns an offset approach, request the relevant directional data. If it concerns aging, request the applicable maintained-performance basis and its conditions. If it concerns physical obstruction, inspect the approach and assembly. These are different investigations, even though all three may initially be described as a signal looking dim.
This approach makes a supplier discussion more productive. Instead of asking which module is brightest, ask which evidence establishes the required performance for the intended configuration and viewing positions. It also avoids making an unsupported connection between watts and visibility. Electrical efficiency, optical distribution and installation geometry all matter, but none should be used as a shorthand answer to the others.
Frequently asked questions
Can lumens be converted directly into the required signal candela value?
Not from a total-flux number alone. Directional distribution is needed; a universal conversion would lose the geometry. (NIST luminous-intensity reference)
Does lower wattage prove better signal performance?
No. Read power and the required optical result together. The reviewed yellow DC rows illustrate different documented outputs. (LEOTEK IL6-P3 10-28 Vdc specification)
Can the survey chart serve as photometric evidence?
No. It reports which factors respondents considered important, not measured candela. (Illinois DOT / ICT-09-043 (2009))
Sources
- NIST luminous-intensity reference. SI Units – Luminous Intensity; accessed October 17, 2026
- LEOTEK IL6-P3 10-28 Vdc specification. Revision July 1, 2019; drawing page 1, model table page 2
- Illinois DOT / ICT-09-043 (2009). Evaluation of LED Vehicular and Pedestrian Modules, April 2009; historical model table and methods; Tables 5-7 and 5-10
Additional research and calculation basis
Cover image: AI-generated editorial illustration for LEOTEK. The generic scene is not a verified installation, product photograph or test record. Technical figures and tables carry their own source credits.