






Multiplying every red, yellow and green indication by 8,760 full-power hours overstates ordinary energy use when those indications are not continuously illuminated. Calendar hours and energized hours are different inputs.
Build the inventory by indication and operating condition. Then compare the existing and proposed loads on the same boundary, using measured information or clearly identified assumptions.
Use the per-indication calculation
Annual energy in kWh equals input watts divided by 1,000, multiplied by annual calendar hours and the energized fraction. Multiply energy by the applicable electricity rate for the energy-cost component.
Use the correct power row. The reviewed IL6-P3 AC sheet lists 6.2 W for its 12-inch red model. Other colors and electrical variants have different entries; a family-wide wattage would lose that distinction. (LEOTEK IL6-P3 80-135 Vac specification)
A transparent example
For illustration, assume a 60-W existing indication, a 6.2-W proposed indication, a 40% energized fraction and an electricity rate of $0.15/kWh over a 365-day year. The 60 W, duty cycle and rate are scenario assumptions, not measured LEOTEK results. Only the proposed 6.2-W entry comes from the reviewed sheet. (LEOTEK IL6-P3 80-135 Vac specification)
The existing indication uses 210.24 kWh; the proposed indication uses about 21.72 kWh. The difference is about 188.52 kWh, or $28.28 in annual energy cost for that example. These numbers do not establish a citywide saving or a universal payback.
| Scenario | Input power (W) | Calendar hours/year | Energized fraction | Annual energy (kWh) | Electricity rate (USD/kWh) | Annual energy cost (USD) | Power basis |
|---|---|---|---|---|---|---|---|
| Existing scenario | 60 | 8760 | 0.4 | 210.24 | 0.15 | 31.536 | Assumed baseline; not a measured LEOTEK value |
| Proposed scenario | 6.2 | 8760 | 0.4 | 21.7248 | 0.15 | 3.25872 | Published AC 12-inch red IL6-P3 sheet, revision 12-12-2018 |
Illustrative calculation, not measured field savings: 365-day year, 40% energized fraction, $0.15/kWh, assumed 60-W existing indication versus a published 6.2-W proposed indication.
Source: IL6-P3 AC specification, page 2, 12-inch red model; remaining values are explicit scenario assumptions. Original source 1
Only the proposed module wattage is sourced from the manufacturer sheet. Baseline, duty cycle and rate are assumptions. Annual energy difference is 188.5152 kWh; energy-cost difference is approximately $28.28. No maintenance, utility demand, project payback or safety result is established.
Keep other costs and loads visible
Separate module energy from controller, communications, detection and other cabinet loads when defining the comparison. Document whether the calculation addresses one indication, a head, an intersection or a larger system.
For a lifecycle estimate, add the relevant equipment, installation, maintenance, access and traffic-control costs using the same boundary for both alternatives. Label replacement and maintenance assumptions instead of treating a warranty duration as a measured failure interval.
Keep the energy and billing boundaries aligned
Use the actual indication inventory, operating fractions and utility terms to connect the modeled kWh difference to the owner’s expenditure. A module calculation should not be presented as a measured citywide result.
Why duty cycle matters more than the number of colored lenses
For an illustrative three-color head with one indication energized at a time, each color has its own power and its own operating fraction. Add the energy of the indications using their respective values. Multiplying three different lenses by a full year of energized operation would describe three continuously energized loads, not the assumed mutually exclusive sequence. Actual installations can include additional heads, arrows and operating modes; inventory those separately.
Assume, only for calculation, equal 60-W baseline power for each of three indications and proposed powers of 6, 7 and 8 W. Let the energized fractions be 0.50, 0.05 and 0.45. The baseline average is 60 W, while the proposed weighted average is 6.95 W. Annual energy is 525.60 kWh versus about 60.88 kWh, a difference of about 464.72 kWh. None of these scenario powers or timing fractions is a product specification or measured deployment result.
The calculation is useful because it exposes the inputs. Changing green time changes the contribution of the green module, and a different yellow-module power affects only its own contribution. A single family-average wattage can hide those relationships. Use the installed indication inventory and documented or measured operating fractions for the project calculation.
Use operating records for the energized hours
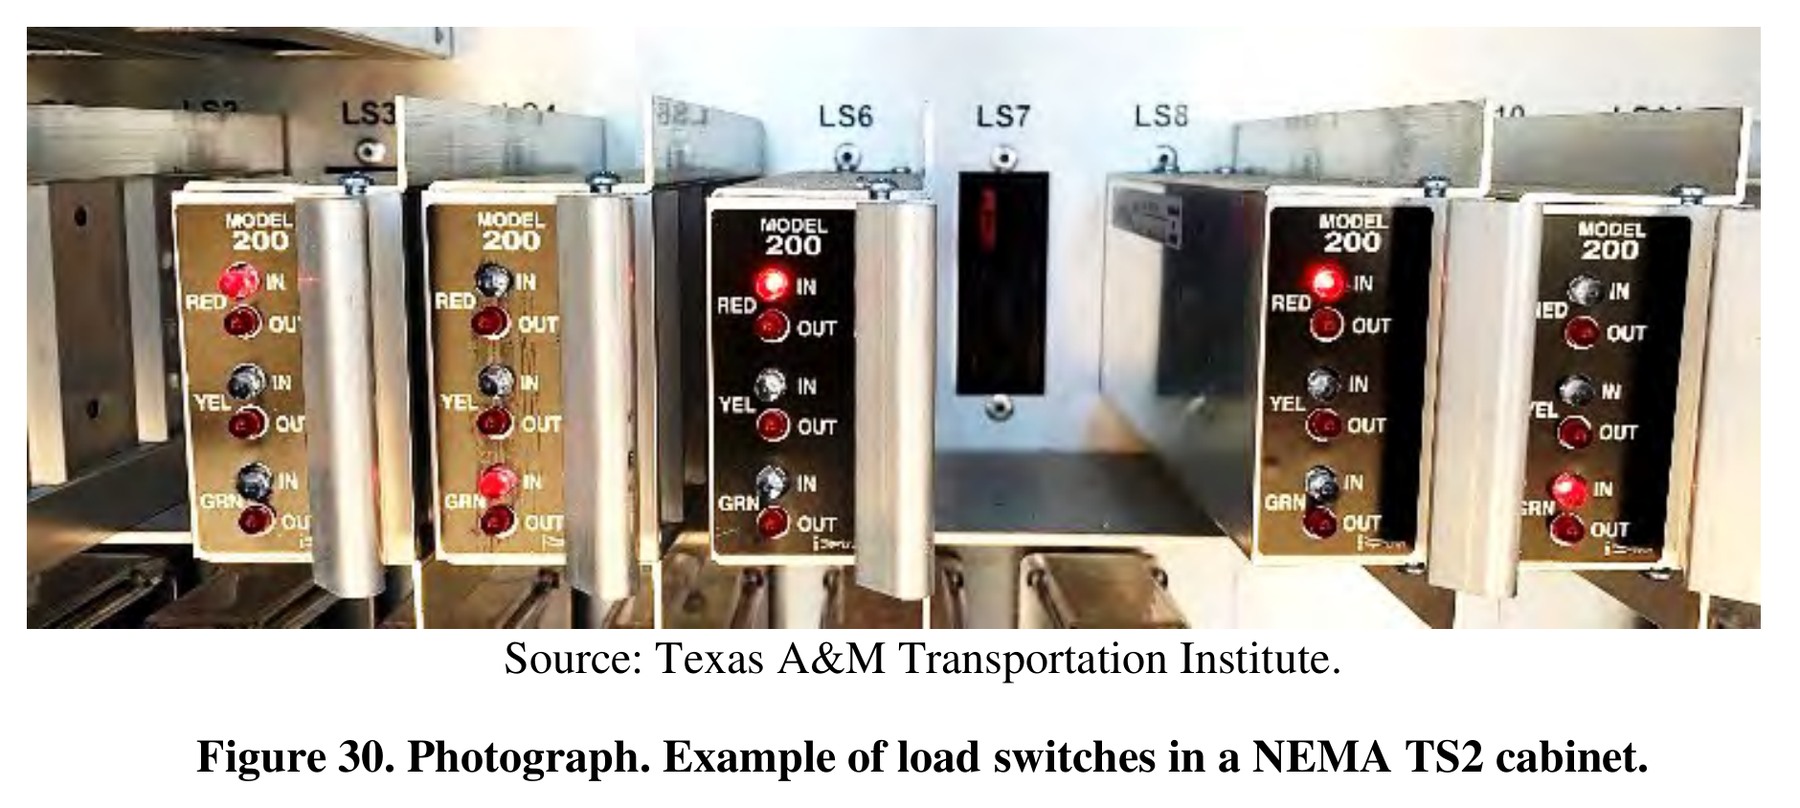
The load-switch photograph makes the separate red, yellow and green output states tangible. It is a snapshot of cabinet hardware, not a record of how many hours each connected indication was energized.
Determine each indication’s energized time from the project’s operating records or an appropriate measurement plan. Include the applicable operating modes and configuration. Do not assign 8,760 energized hours to every colored lens merely because the intersection operates throughout the year.
Keep that calculation boundary consistent with the baseline. Whole-cabinet measurements can include loads beyond the signal modules, while a per-module comparison covers the stated module inputs. The photograph supplies context for asking the right question; it supplies no wattage, duty-cycle or energy-saving result.
An energy reduction and a bill reduction can differ
The energy model calculates kWh. The bill follows the applicable tariff and metering arrangement. A project may have energy charges, fixed charges, other cabinet loads or a billing method that does not automatically track each module replacement. Review the actual utility terms before converting avoided kWh into a promised reduction in the owner's expenditure.
The distinction also matters when a cabinet serves more than the visible indications. Controller electronics, detection, communications and other equipment can remain in the metered boundary. If a project reduces only module energy, multiplying that percentage by the entire intersection bill overstates the modeled saving. Compare the same boundary before and after and retain the loads outside the conversion.
FHWA's FHWA's asset-management primer, Chapter 4 describes a Connecticut asset-management example that developed from signal energy-consumption tracking. That is useful operational context: an energy inventory can become a durable asset record when location, ownership and equipment attributes are linked. It does not provide a savings percentage for the LEOTEK scenario in this article.
Use a sensitivity range before turning a calculation into a proposal
Return to the per-indication example above. The energy difference is 188.5152 kWh under the stated assumptions. At $0.10/kWh it is worth about $18.85 per year; at $0.20/kWh it is worth about $37.70. Changing the energized fraction from 40 percent to 20 percent halves the modeled energy difference. These arithmetic relationships show why a location-specific rate and operating condition matter more than an unsupported universal saving.
For a simple payback illustration, assume an incremental installed cost of $120 for that one indication and retain the original $28.28 annual energy-cost difference. Energy-only simple payback is about 4.24 years. This excludes maintenance, discounting, replacement timing and other project costs; it is not a quoted price or LEOTEK payback claim. A lifecycle comparison should include those additional cash flows on a consistent basis, using the approach explained in NIST Handbook 135.
Measure the baseline before it disappears
A replacement project can remove the very equipment needed to establish its baseline. Plan the measurement or documentation method before conversion, identify representative configurations and record operating conditions. Retain the original inventory, measurement boundary, instrument or data source, observation period and assumptions. If a value is estimated rather than measured, label it at the point of use.
After conversion, reconcile the installed inventory before comparing results. A change in the number of heads, operating schedule or cabinet equipment can change the load independently of the module efficiency. Explain those changes in the comparison rather than assigning every difference to the new product. The same discipline applies to avoided-maintenance claims: keep measured service history separate from planning assumptions.
This produces a proposal the owner can interrogate. Each input has a source or an explicit assumption, each cost belongs to a stated boundary, and the result can be recalculated when a tariff or operating plan changes. That is more useful than a large percentage detached from the conditions that created it.
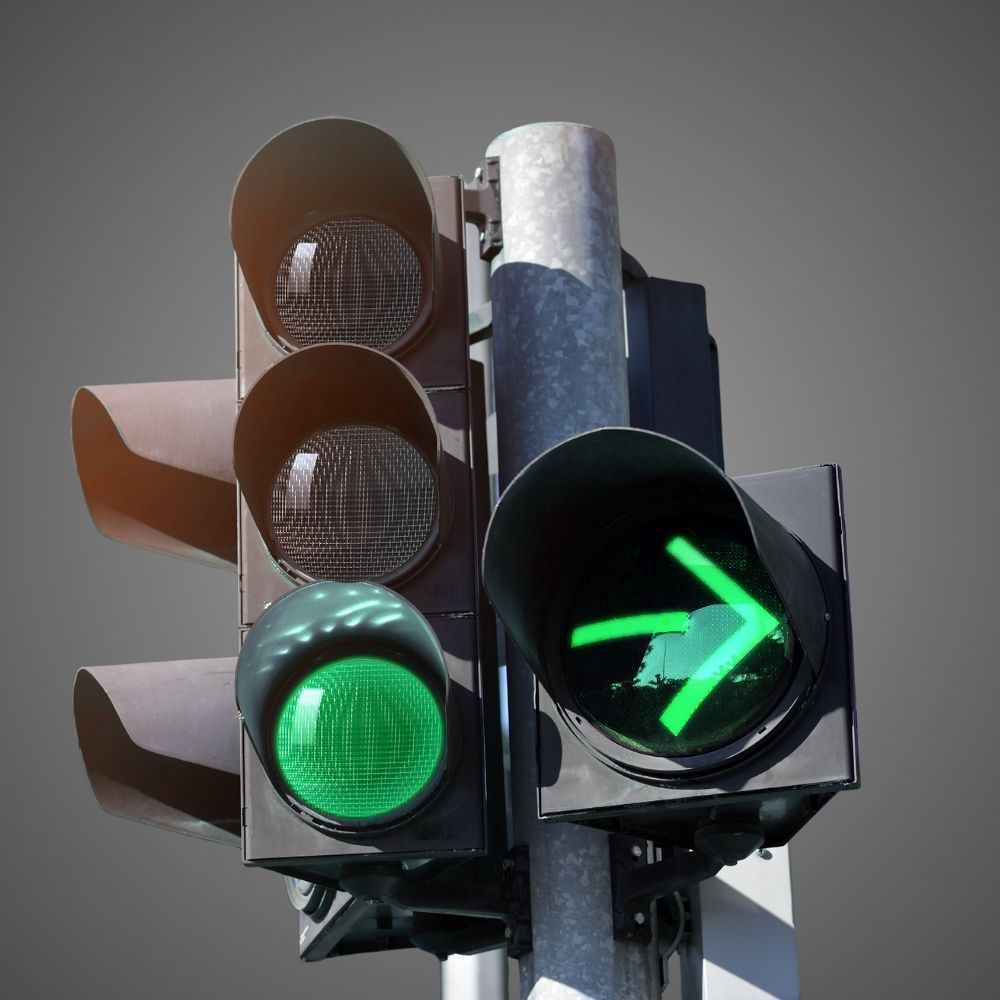
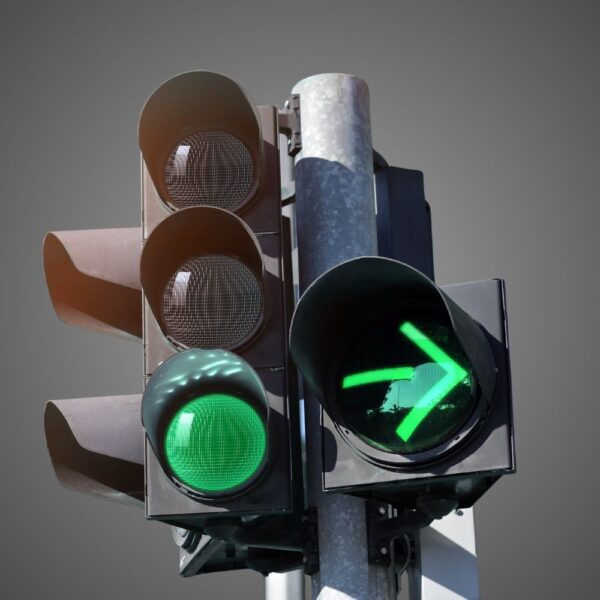
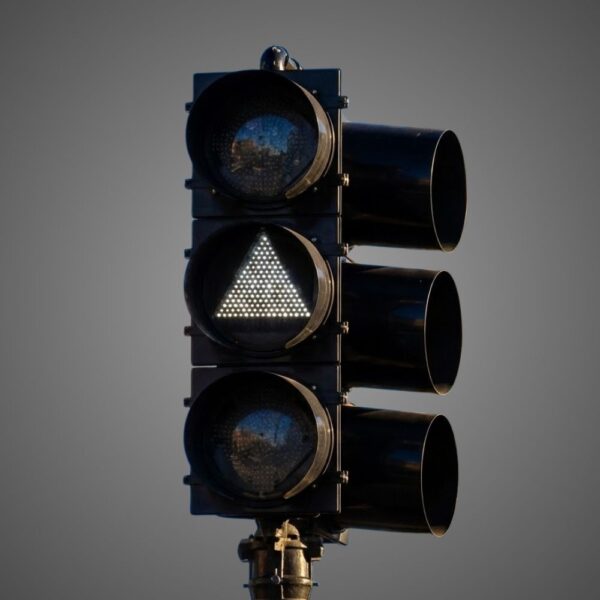
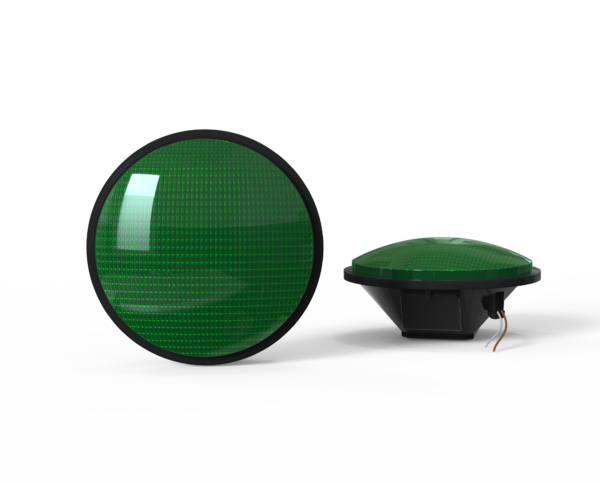
The circular face and separate arrow make the inventory question visible: a count of poles or housings is not yet a count of energized indications. List the indication loads included in the calculation and assign each its documented operating hours. Do not read a duty cycle, wattage or energy saving from the illuminated appearance in this illustration.
Check the fleet count before multiplying the saving
The calculation unit is an energized indication, while the purchasing unit may be a module and the asset inventory may describe a complete intersection. Those counts are not interchangeable. An intersection can have multiple faces serving the same movement, pedestrian indications and other equipment. Establish which devices the estimate includes before multiplying a per-module saving by the number of intersections.
In a hypothetical project with 40 otherwise identical three-color faces, the earlier example's 464.718-kWh annual saving per face becomes 18,588.72 kWh. At an assumed marginal energy price of $0.15/kWh, the modeled energy component is $2,788.31 per year. The calculation assumes identical powers, duty fractions and operating hours for all 40 faces. It does not include pedestrian modules, cabinet equipment or non-energy charges, and it is not a LEOTEK installation result.
The word marginal matters. Dividing a whole electricity bill by its kWh can allocate fixed charges into an average price. Multiplying savings by that average may overstate avoided cost when the fixed charges remain. Use the actual applicable billing structure and the utility's accepted treatment of the converted equipment. If billing is based on an equipment schedule, inventory accuracy can affect the timing and amount of the recognized saving.
Treat before-and-after energy as a comparison problem
A meter records everything inside its measurement boundary. If the project replaces signal modules and adds unrelated cabinet loads at the same time, the net meter change combines both effects. A smaller-than-expected reduction does not by itself prove the module estimate was wrong. Establish what changed within the boundary and whether the baseline and post-project periods represent comparable operation.
Keep measured input power, nameplate values and modeled duty fractions distinct in the worksheet. An installation count is not a power measurement; a typical catalog value is not necessarily the measured value for each delivered configuration. Where a project requires a defensible measured result, agree on the method and equipment with the responsible personnel. Do not infer a field measurement from the precision of a spreadsheet result.
Uncertainty can be shown without making the estimate unwieldy. Run a lower and upper case for the assumptions that materially influence the result, such as baseline power and operating fractions. If a small change in one assumption reverses the financial conclusion, resolving that assumption is worth more than reporting additional decimal places. State which values are observed, which are documented product values and which remain estimates.
Keep the maintenance case alongside the energy case
Energy can be calculated independently of a predicted maintenance benefit. That separation helps prevent double counting. If the financial model already includes avoided replacement visits, do not add the same visits again under a separate reliability benefit. Likewise, a product remedy and an avoided truck visit are different economic events. Only count benefits supported by the selected baseline and the project's actual responsibilities.
FHWA's lifecycle-planning chapter provides the lifecycle-planning context for comparing interventions over time. A useful proposal can show the energy-only result first, then a separate case with documented maintenance assumptions. Decision makers can see which part is supported by input powers and energized hours and which part depends on future service behavior. That makes the estimate more credible and easier to revise after the agency has its own operating records.
Frequently asked questions
Should each color use 8,760 energized hours?
Not automatically. Use its documented or explicitly assumed duty cycle and the correct annual-hours boundary.
Are the example savings a LEOTEK field result?
No. They are scenario arithmetic using a published proposed-module wattage and labelled assumptions for the other inputs.
Can the percentage saving establish payback?
Not by itself. Payback also needs the project's relevant incremental costs and documented operating assumptions.
Sources
- LEOTEK IL6-P3 80-135 Vac specification. Revision December 12, 2018; drawing page 1, model table page 2
- FHWA LED-conversion safety summary (2013). FHWA-HRT-13-070, August 2013; historical observational safety evaluation, not current module energy testing
Additional research and calculation basis
- FHWA, Applying Transportation Asset Management to Traffic Signals, Chapter 4; asset information and interfaces
- NIST Handbook 135, 2022 edition; lifecycle-cost methodology, not a prescribed municipal discount rate
Cover image: AI-generated editorial illustration for LEOTEK. The generic scene is not a verified installation, product photograph or test record. Technical figures and tables carry their own source credits.