


















Streetlight carbon reporting starts with a city pairing documented electricity use in kilowatt-hours (kWh) with a documented, applicable electricity emission factor. A credible streetlight carbon report also records its asset boundary, data gaps, factor vintage, and baseline so readers can tell an inventory from an estimate of avoided emissions.
For municipal teams, the hard part is rarely the multiplication. The hard part is deciding which assets and records belong in the calculation, reconciling incomplete data, and preserving the assumptions that make the result understandable months later. This article offers a practical reporting framework for roadway-lighting programs; it is not greenhouse-gas assurance, legal advice, or a substitute for the city’s reporting policy.
Key takeaways
- Use metered or utility-billed kWh where available, and label modeled or incomplete data clearly.
- Record the emission factor’s publisher, geography, unit, dataset version, and vintage beside every reported total.
- Keep electricity consumption reporting separate from a baseline comparison that estimates avoided emissions.
- Treat dimming schedules as operational inputs, not proof of savings, until the energy data and baseline support a calculation.
Start with a reporting boundary, not a dashboard total
Streetlight carbon reporting begins with a decision about what is being reported. A city might be reporting electricity associated with municipal roadway luminaires, contractor-operated lighting, parking-area fixtures, or a defined pilot area. Those are different asset populations, even when they appear in the same dashboard.
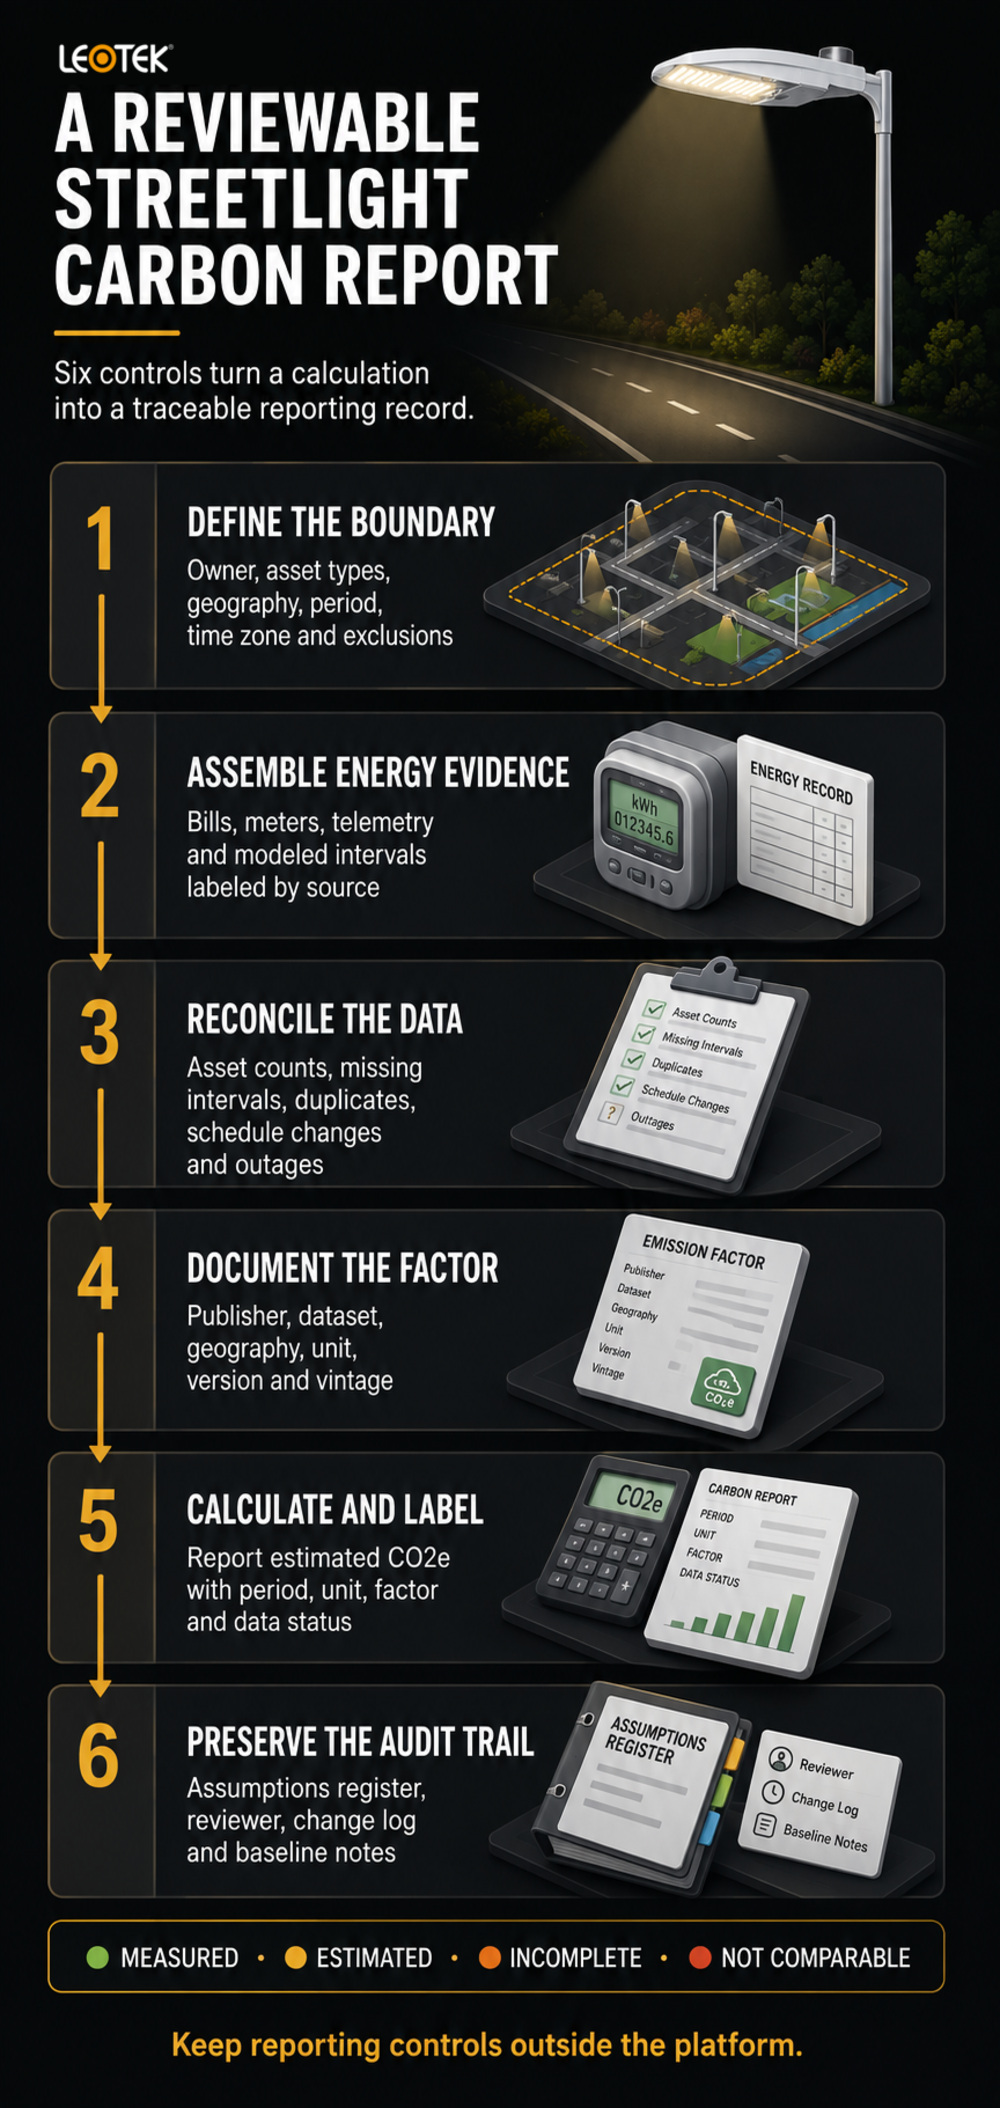
Write the boundary in plain language before assembling data. State the owner or operator, included asset types, geographic area, reporting period, and time zone. Also record exclusions, such as decorative lighting, park lighting, temporary construction lighting, or accounts that are billed with an unrelated facility load. A concise boundary statement prevents an annual total from being compared with a narrower monthly total later.
Assign a stable identifier to the boundary, such as a report name and period, rather than relying on a dashboard label that can change. Keep the asset register or account list that supports that identifier with the working papers. This does not make the estimate assured, but it gives a future reviewer a way to understand what the report did and did not include.
Separate an inventory from an avoided-emissions estimate
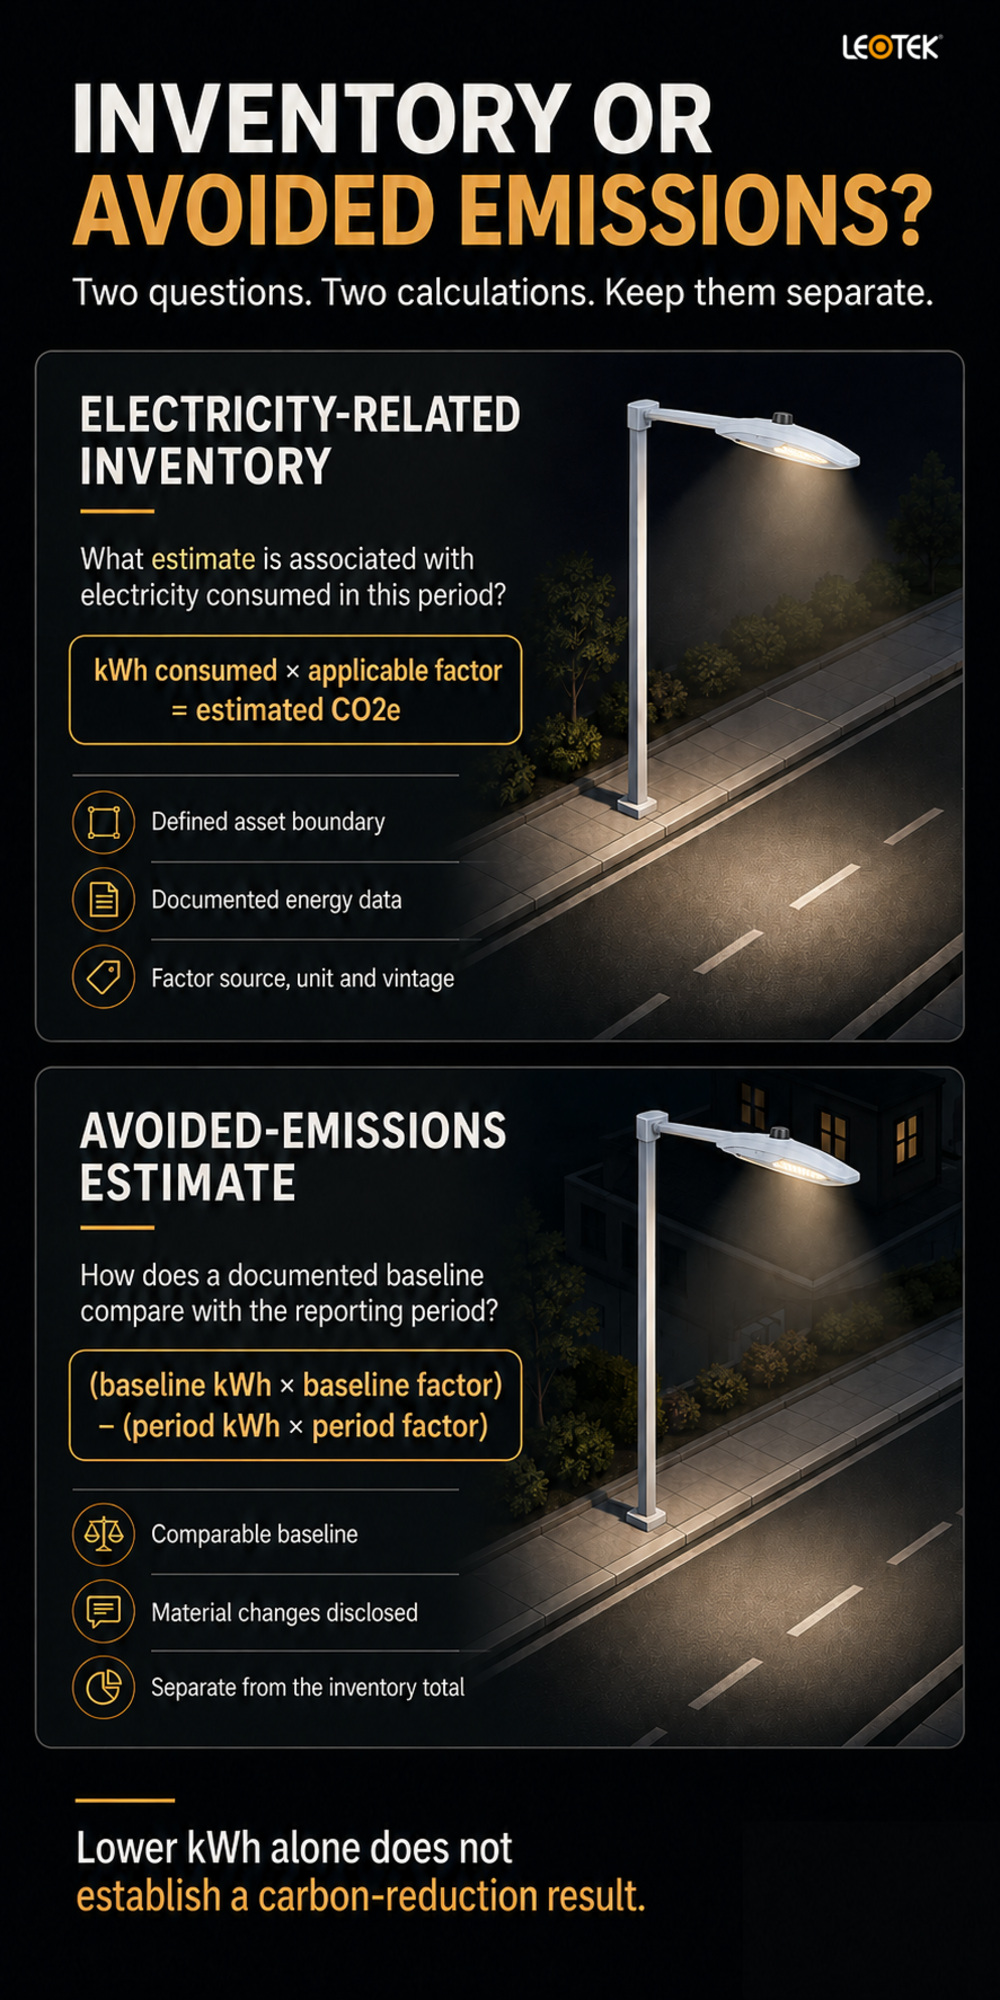
An electricity-related inventory answers, “What emissions estimate is associated with the electricity consumed during this period?” An avoided-emissions estimate answers a different question: “How does a documented baseline compare with the reporting period under stated assumptions?”
That distinction matters when a program includes a retrofit, new controls, or scheduled dimming. Lower kWh may be an important observation, but it is not enough by itself to establish a carbon-reduction result. The comparison needs a baseline period, a reason for the chosen baseline, the factors used for both periods, and an explanation of material changes in the asset population or operating conditions.
The Greenhouse Gas Protocol Scope 2 Guidance addresses measurement of purchased or acquired electricity, steam, heat, and cooling. It can inform organizational reporting decisions, but a municipal team should still follow its applicable reporting rules and obtain the review its own inventory process requires. Do not assume that a label used in one organization’s inventory automatically resolves another organization’s boundary or disclosure treatment.
Build a reliable streetlight energy dataset
For this reporting framework, prioritize documented electricity use for the defined assets and period. Utility bills and meters may be useful records, although their usefulness depends on whether the account isolates the streetlight load. A revenue meter, submeter, or other documented source may provide a more asset-specific record, depending on how the account and assets are configured. Controller telemetry can add operational detail, but it should not automatically be treated as equivalent to billing data or a meter.
Create a source field for every data row. Useful labels include utility bill, revenue meter, submeter, controller telemetry, and modeled estimate. If a city must estimate a missing interval, keep the estimate separate from observed data and identify the method used. For example, a report could say that a period was estimated from documented operating assumptions. It should not describe that estimate as measured consumption.
Reconcile data before calculating emissions
Reconciliation is the step that makes a total more than a dashboard export. Compare the included asset count with the reporting boundary. Review whether accounts, meters, or controller groups were added or removed. Flag outages, communication gaps, commissioning periods, schedule changes, and any months with partial data.
The review does not need to turn into a complicated data-science project. A monthly check can ask a few practical questions:
- Does the reported kWh cover the same asset population as the prior period?
- Is the data source consistent, or did the report shift from a bill to telemetry or an estimate?
- Are there missing intervals, duplicate records, or unit conversions that affect comparability?
- Did dimming schedules, outages, or changes in operating hours materially alter the interpretation?
Documenting exceptions is more useful than hiding them. A report that identifies a partial month and explains its treatment gives a reviewer information needed to evaluate the result. A polished total without data lineage does not.
Where bills and telemetry do not agree, preserve both records and investigate the difference before selecting a reporting value. Differences can arise from a boundary mismatch, a timing cutoff, a communications issue, or an aggregation rule. The report does not need to diagnose every difference, but it should not silently blend unlike sources into a single “measured” number.
Select and document an electricity emission factor
The calculation requires an emission factor, but “the electricity factor” is not a single universal number. Factor selection should match the reporting purpose and the geographic and temporal context of the electricity data. The U.S. Environmental Protection Agency’s eGRID resource provides U.S. power-sector data that include emissions and emission rates, along with generation, heat input, and resource-mix information.
For each factor used, record its publisher, source or dataset name, version or year, geographic scope, unit, and the date the team accessed it. Confirm the unit before multiplying. A kWh total must be paired with a factor expressed in a compatible unit, or the conversion must be shown. This simple record makes later updates far easier when a city changes data sources or a factor dataset is revised.
Match the factor to the question being answered
The factor used for consumption reporting may not be appropriate for an avoided-emissions comparison. EPA’s Greenhouse Gas Equivalencies Calculator distinguishes average factors for electricity consumed from non-baseload factors for avoided electricity in the calculator’s methodology. The same EPA page also cautions that its results are approximate and should not be used for emission inventories or formal carbon-emissions analysis.
That caution is useful for municipal reporting. The calculator can help communicate an estimate in familiar terms, but it is not a replacement for a documented reporting factor and methodology. Teams should select and explain factors according to their reporting policy and the purpose of the calculation, rather than using a familiar web tool as a shortcut.
Source note: the Greenhouse Gas Protocol guidance and EPA resources cited in this article were accessed July 29, 2026. Confirm the applicable dataset version and local reporting requirements when preparing a report.
Calculate CO2e and preserve an audit trail
With a defined energy dataset and factor, the core calculation is straightforward:
estimated electricity-related carbon dioxide equivalent (CO2e) = electricity consumed (kWh) × selected electricity emission factor (CO2e/kWh)
The word “estimated” is intentional. The calculation is only as representative as the boundary, energy data, factor, and conversions behind it. Present the result with its unit, reporting period, and factor source. Avoid presenting an estimate as a precise physical measurement of emissions at a specific streetlight.
Reporting status: Treat the result as an estimate unless the energy source, boundary, factor, and data treatment are documented. This framework supports transparent reporting; it is not assurance or a substitute for the city’s reporting policy.
For a documented period-over-period comparison, use a separate expression:
estimated avoided CO2e = (baseline kWh × baseline factor) − (reporting-period kWh × reporting-period factor)
This framework is not an assurance method. It is a transparent way to show what the comparison contains. If the baseline uses different assets, a different factor geography, or a different data source, say so. A calculation can still be useful, but its limits should travel with the number.
Maintain an assumptions register and change log
An assumptions register is a short table that travels with the report. It can contain the reporting boundary, asset count, data source, completeness check, missing-data treatment, factor reference, factor type and rationale, conversions, rounding rule, reviewer, and report date. For a reduction comparison, add the baseline definition and the reason it is comparable.
Keep a change log as well. If a utility account is reassigned, a controller group is renamed, or an old estimate is replaced with a bill, record the change and whether historical results were restated. This protects the reporting process from a common problem: a year-over-year chart that changes because the underlying population changed, not because streetlight energy use changed.
Create a monthly reporting template that survives review
A compact monthly register makes the method repeatable. The following blank structure is a reporting aid, not a completed example or a claim about any city:
| Field | Record for each reporting period |
|---|---|
| Reporting period | Month, reporting dates, and time zone |
| Included assets | Boundary description and asset count |
| Energy use | kWh total and whether it is measured or estimated |
| Energy-data source | Utility bill, meter, telemetry, or documented estimation method |
| Completeness | Missing intervals, exclusions, and reconciliation notes |
| Emission factor | Publisher, dataset/version, geography, unit, and vintage |
| Estimated CO2e | Calculation result and unit |
| Baseline comparison | Definition and comparability notes, if used |
| Review record | Preparer, reviewer, date, rounding, and change-log reference |
The table is deliberately small. Its value comes from consistency. When every month contains the same fields, a city can see whether the evidence behind a trend has changed. The reporting team can then distinguish a true operational change from a changed factor, asset list, or data-quality issue.
The same register can support a year-end summary. Retain the individual monthly records rather than only the annual total, because the monthly notes show when a factor or boundary changed. That record gives sustainability, operations, and procurement stakeholders a common basis for discussing the result without implying that the calculation settles engineering, accounting, or policy questions.
Report dimming and retrofit results without overstating carbon reduction
Dimming is a control action, not a carbon result. A schedule may be configured, adjusted, or interrupted. Asset-level conditions can vary, and the reporting period may include outages, commissioning, changes in operating hours, or a changed number of luminaires. For those reasons, describe dimming as an operational input until a documented energy comparison supports a separate estimate.
The same discipline applies to a retrofit. Do not calculate a program-wide reduction from nameplate wattage alone, and do not treat a vendor savings statement as measured consumption. Start with the reported kWh for the defined baseline and reporting periods. Then identify any material changes that affect the comparison, including asset additions, removals, scheduling changes, and data-source changes.
Make uncertainty visible
Useful reporting labels include measured, estimated, incomplete, and not comparable. These labels make a report more actionable because they help an operations or sustainability team prioritize the next data improvement. They also avoid turning reasonable planning estimates into claims of verified emissions reductions.
A brief narrative beside the total can be enough: which data were observed, which were estimated, what factor was used, and what exceptions remain. There is no need to pad the report with generic sustainability language. The purpose is to make the calculation reproducible and appropriately bounded.
Use connected-lighting data as a reporting input
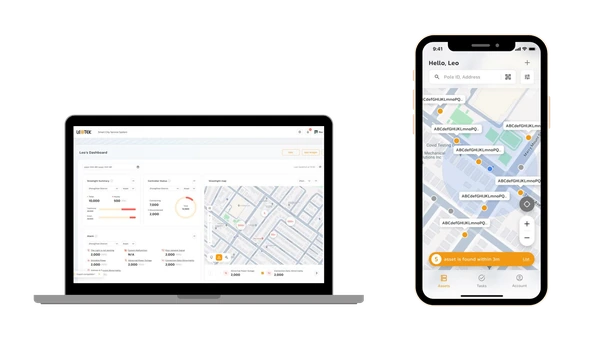
Connected-lighting systems can help organize the operational records that a reporting process needs. LEOTEK’s connected streetlight management information describes first-party functions such as remote operations, scheduled dimming, energy tracking, reporting, alerts, and asset management. Those functions may help a team identify data fields, group assets, and investigate exceptions.
LEOTEK’s RenAI roadway infrastructure management page also describes energy reporting, scheduled dimming, controller data, and asset-management functions. Those are product descriptions, not an independent validation of data accuracy, reporting assurance, or emissions outcomes. Whether a particular deployment can support a city’s reporting workflow depends on its configuration, data governance, available records, and the city’s review process.
Keep the reporting controls outside the platform
Even a well-organized platform report does not decide the inventory boundary, choose the appropriate factor, or resolve missing-data treatment on its own. The city still needs a documented methodology and a reviewer who can explain the source data and assumptions. Utility reconciliation may remain necessary when the purpose is to report electricity consumption for a defined account or asset group.
For teams evaluating documentation alongside connected-lighting options, the LEOTEK technical documents hub is an appropriate starting point. Check each document’s date, model, revision, and applicability before using it for a technical or procurement decision.
Streetlight carbon reporting FAQs and next step
Is streetlight electricity automatically a Scope 2 emission?
Not automatically. Scope 2 is the Greenhouse Gas Protocol term for purchased or acquired electricity, steam, heat, and cooling; classification and disclosure still depend on the organization’s boundary and applicable reporting program. A city should document who controls or purchases the electricity and follow its own reporting requirements.
What is the best emission factor for a municipal streetlight report?
There is no single factor that fits every report. Use a source appropriate to the report’s geography and purpose, then record the publisher, version, unit, and vintage. eGRID is a relevant U.S. source for power-sector emissions data, but the selected factor still needs a documented rationale.
Can dimming schedules prove carbon reduction?
No. A schedule describes an intended control action. A reduction estimate needs a documented baseline, reporting-period energy data, selected factors, and a record of material changes or gaps.
Can connected-lighting software replace utility-bill reconciliation?
Not necessarily. Platform data may be useful reporting input, but a city should determine whether it matches the boundary and accuracy needed for its specific reporting purpose. Reconciliation remains important when utility-account consumption is the basis for the report.
Teams with a defined roadway-lighting data or documentation question can contact LEOTEK to explore relevant connected-lighting information. Any technical evaluation should still confirm configuration, records, and reporting requirements for the specific deployment.
References
- ghgprotocol.org, Greenhouse Gas Protocol Scope 2 Guidance; accessed July 29, 2026.
- epa.gov, eGRID; accessed July 29, 2026.
- epa.gov, Greenhouse Gas Equivalencies Calculator; accessed July 29, 2026.
- LEOTEK, connected streetlight management; accessed July 29, 2026.
- LEOTEK, RenAI roadway infrastructure management; accessed July 29, 2026.
- LEOTEK, LEOTEK technical documents; accessed July 29, 2026.